Procrucement analytics using power BI
تفاصيل العمل
Procurement analytics using power BI
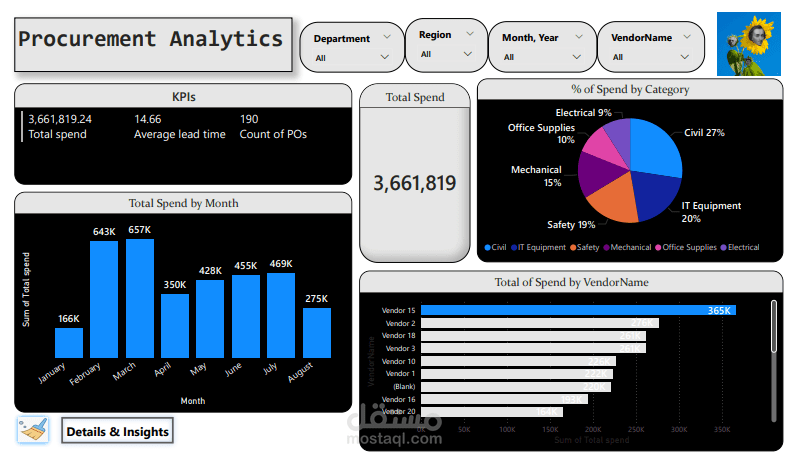
I’m pleased to share my first Power BI project, where I built an interactive Procurement Analytics Dashboard to analyze purchasing operations and uncover key insights for decision-making.
I worked with a dataset of 200 purchase requisitions and 190 purchase orders from multiple vendors, using Power BI to transform raw data into clear visuals and meaningful insights about procurement performance.
?️ What I Did
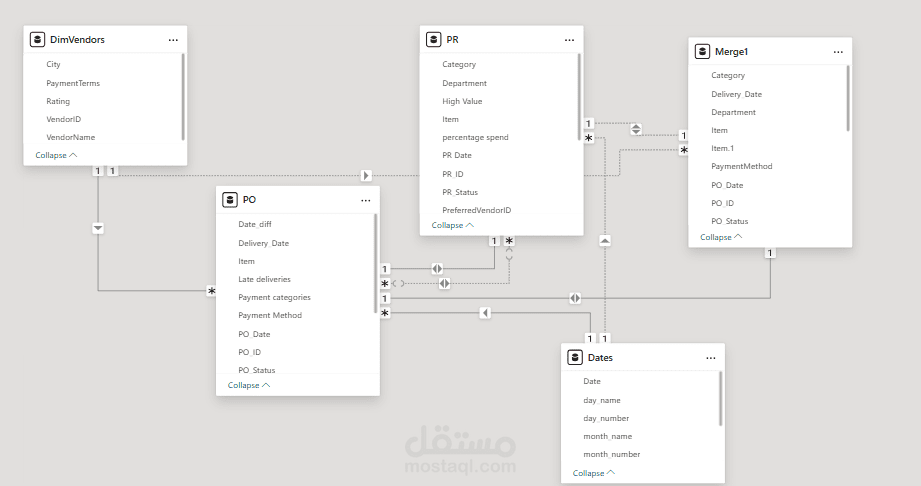
• Cleaned and prepared data in Power Query (removed unnecessary columns, renamed fields, filtered data, and merged PR–PO tables).
• Created DAX measures to track key metrics like total spend, average lead time, and late deliveries.
• Built relationships between PR, PO, and Vendor tables for a connected data model.
? Key Insights I Extracted
• Most early procurement activities were concentrated in Alexandria, though the region also recorded a high percentage of low-value orders.
• Late deliveries were mostly linked to bank transfers and cash payments, suggesting that credit card payments help speed up the process. Offering promotions or discounts for credit card users could further encourage on-time and early deliveries.
• High-value orders (over 2,000 EGP) made up 96% of total orders and accounted for 99% of total spending, showing that larger purchases dominate overall sales.
• The KPIs reflect steady business growth but also highlight an opportunity to reduce lead time to improve customer satisfaction.
• Tile boxes achieved the highest total sales, contributing 6.16% of overall revenue.
• Sales peaked in February and reached their highest level in March, likely driven by promotional campaigns, before gradually declining toward the end of the year.
✨ This project helped me strengthen my skills in Power Query, DAX, and data storytelling — and it made me appreciate how meaningful insights can come from a well-designed dashboard.