Customer & Product Analytics Dashboard
تفاصيل العمل
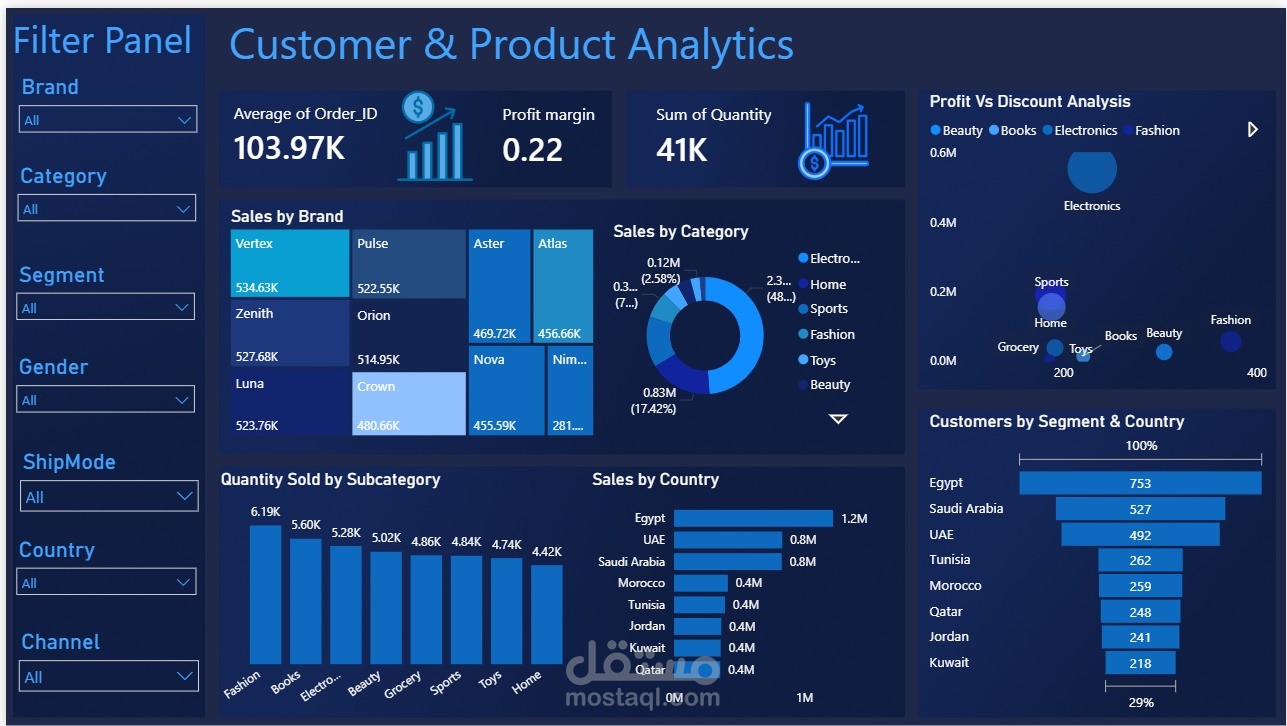
Customer & Product Analytics Dashboard
This dashboard dives deeper into product and customer behavior analysis.
• Key Features: • Average Orders, Profit Margin & Quantity
KPIs
• Sales by Brand (Treemap)
• Sales by Category (Donut Chart)
• Profit vs Discount Analysis (Scatter Plot)
• Quantity Sold by Subcategory
• Sales by Country
• Customers by Segment & Country (Funnel Chart)
• Fully Interactive Filter Panel (Brand, Category, Segment, Gender, Ship Mode, Country, Channel)
• Business Value: Enables deeper insights into customer segments, product performance, and pricing strategies.
X Tools & Skills Used:
• Microsott Power Bl
• Data Modeling (Star Schema - Fact & Dimension Tables)
• DAX Measures & KPIs
• Power Query (Data Cleaning & Transformation)
• Interactive Slicers & Drill Features
• Custom Dark Theme Design
• Figma (for dashboard layout & Ul/UX prototyping) el focused heavily on clean layout, visual hierarchy, and executive-level storytelling through data.
This project strengthened my skills in: V Business Intelligence
V Data Visualization V Analytical Thinking
Dashboard UI/UX Design
v
Performance Analysis
Global Sales
Retail Sales Performance Dashboard
Analysis
2.05M
443.72K
Customer &