Mercedace AMG Sales Dashboard
تفاصيل العمل
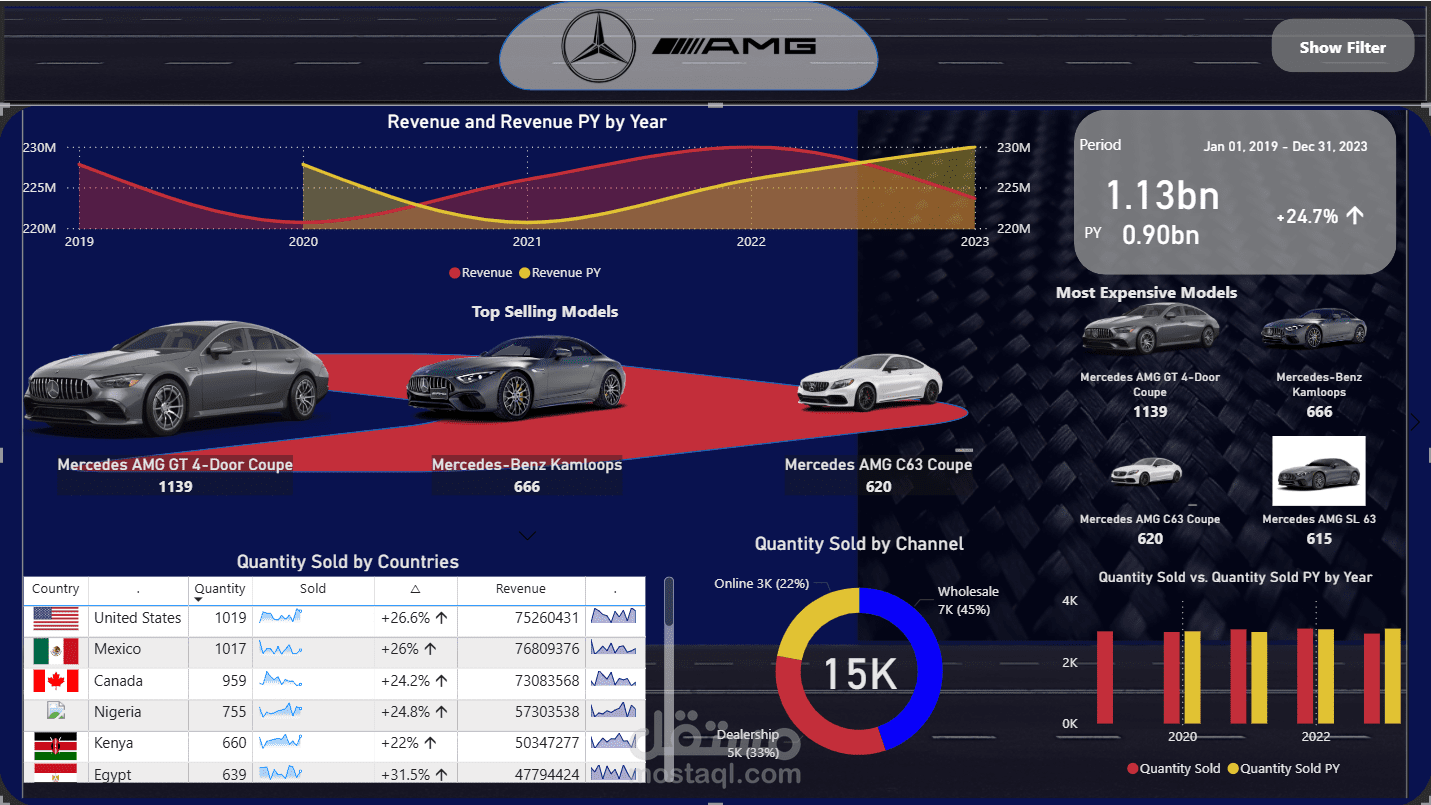
A dynamic, premium-themed Power BI dashboard designed to track 5 years of Mercedes AMG sales, revenue, and market distribution (2019–2023).
Key Highlights:
Financial KPIs: Visualized 1.13bn in total revenue and tracked Year-over-Year (YoY) growth (+24.7%) using DAX.
Product Insights: Highlighted top-selling and premium models using custom image visuals and volume metrics.
Market Analysis: Broke down sales by global regions (using matrix tables with sparklines) and distribution channels (Wholesale, Dealership, Online).
Trend Tracking: Utilized area and bar charts to compare current vs. previous year (PY) metrics for clear performance tracking.
Skills Used: Power BI, DAX, Data Visualization, Data Modeling, UI/UX Design.