? Adidas Sales & Performance Dashboard
تفاصيل العمل
I developed an interactive Power BI dashboard to analyze Adidas sales data and uncover actionable insights that support better business decisions.
? Project Objective:
To perform a comprehensive analysis of sales performance, customer behavior, and business metrics using modern data analytics techniques.
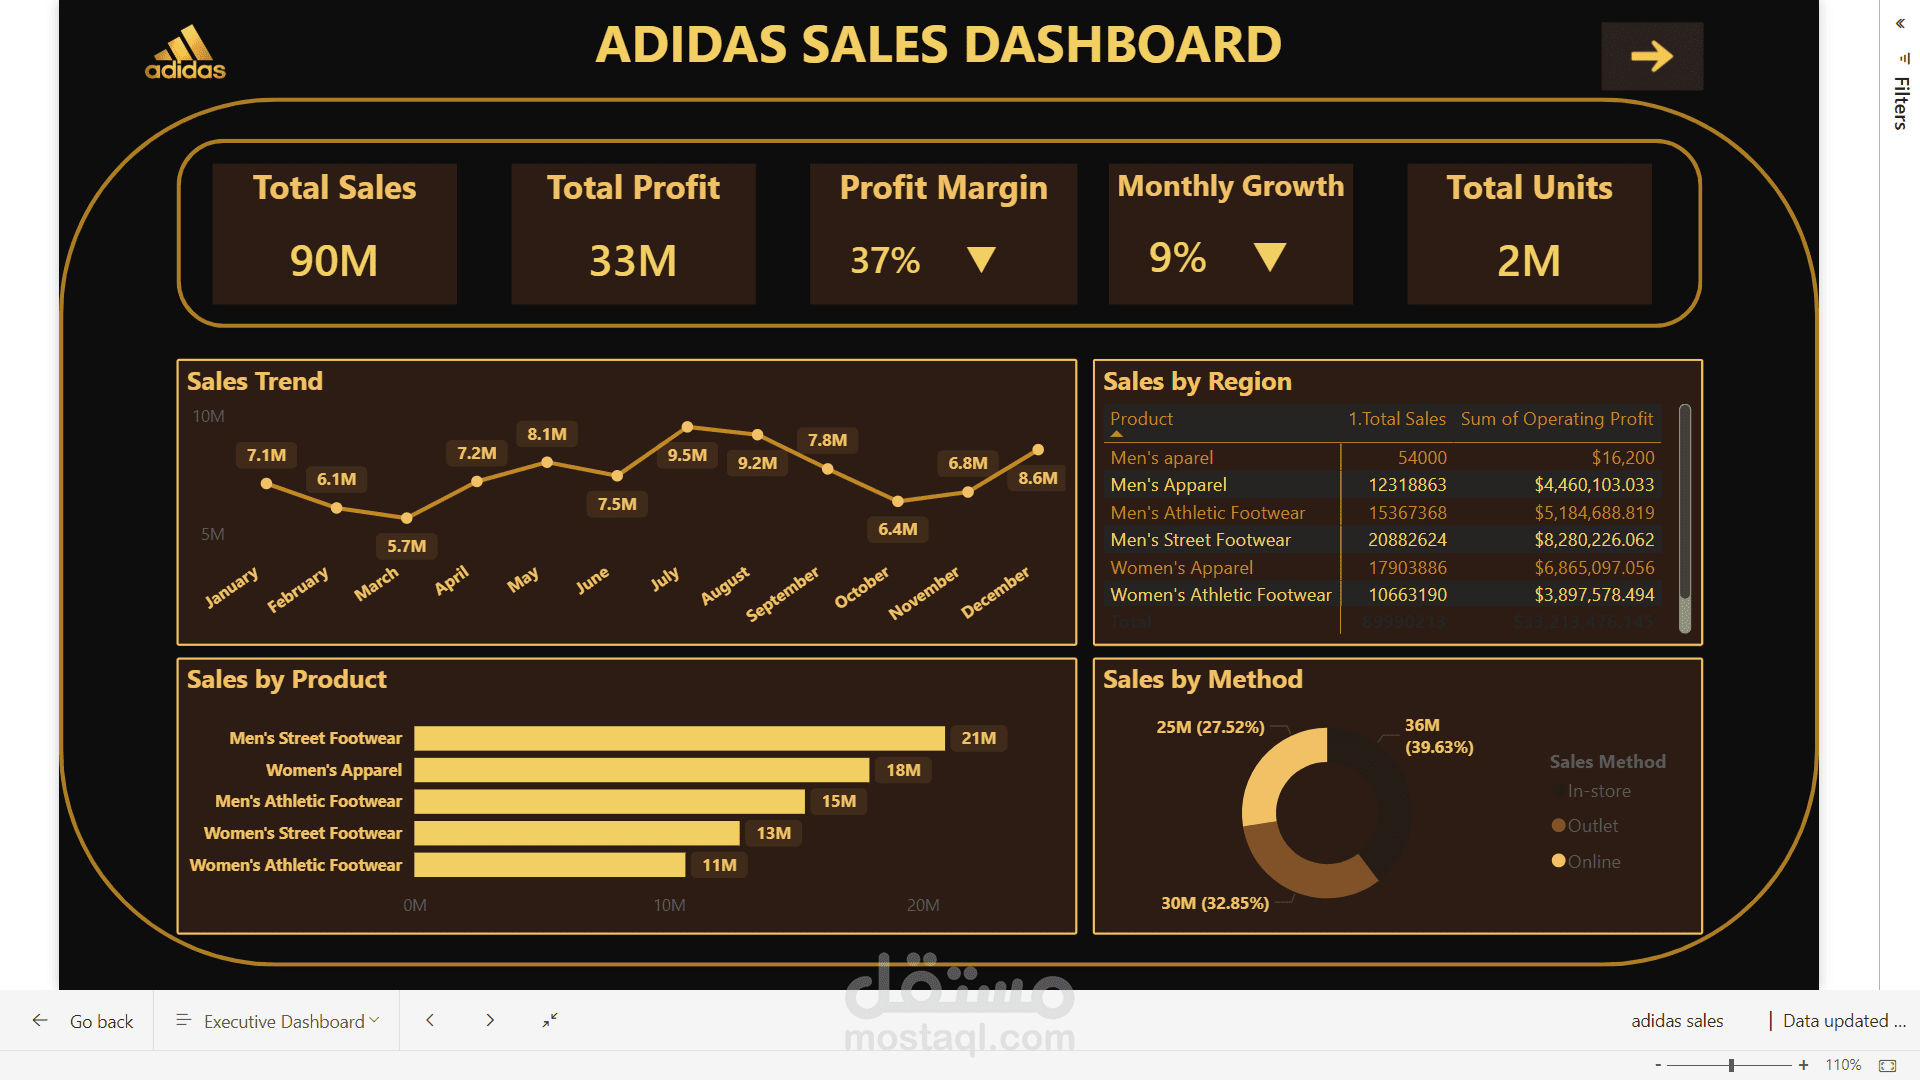
? Key Features:
* Data Cleaning & Transformation (Power Query)
* Creation of key KPIs, including:
• Monthly Sales Growth
• Average Profit Margin
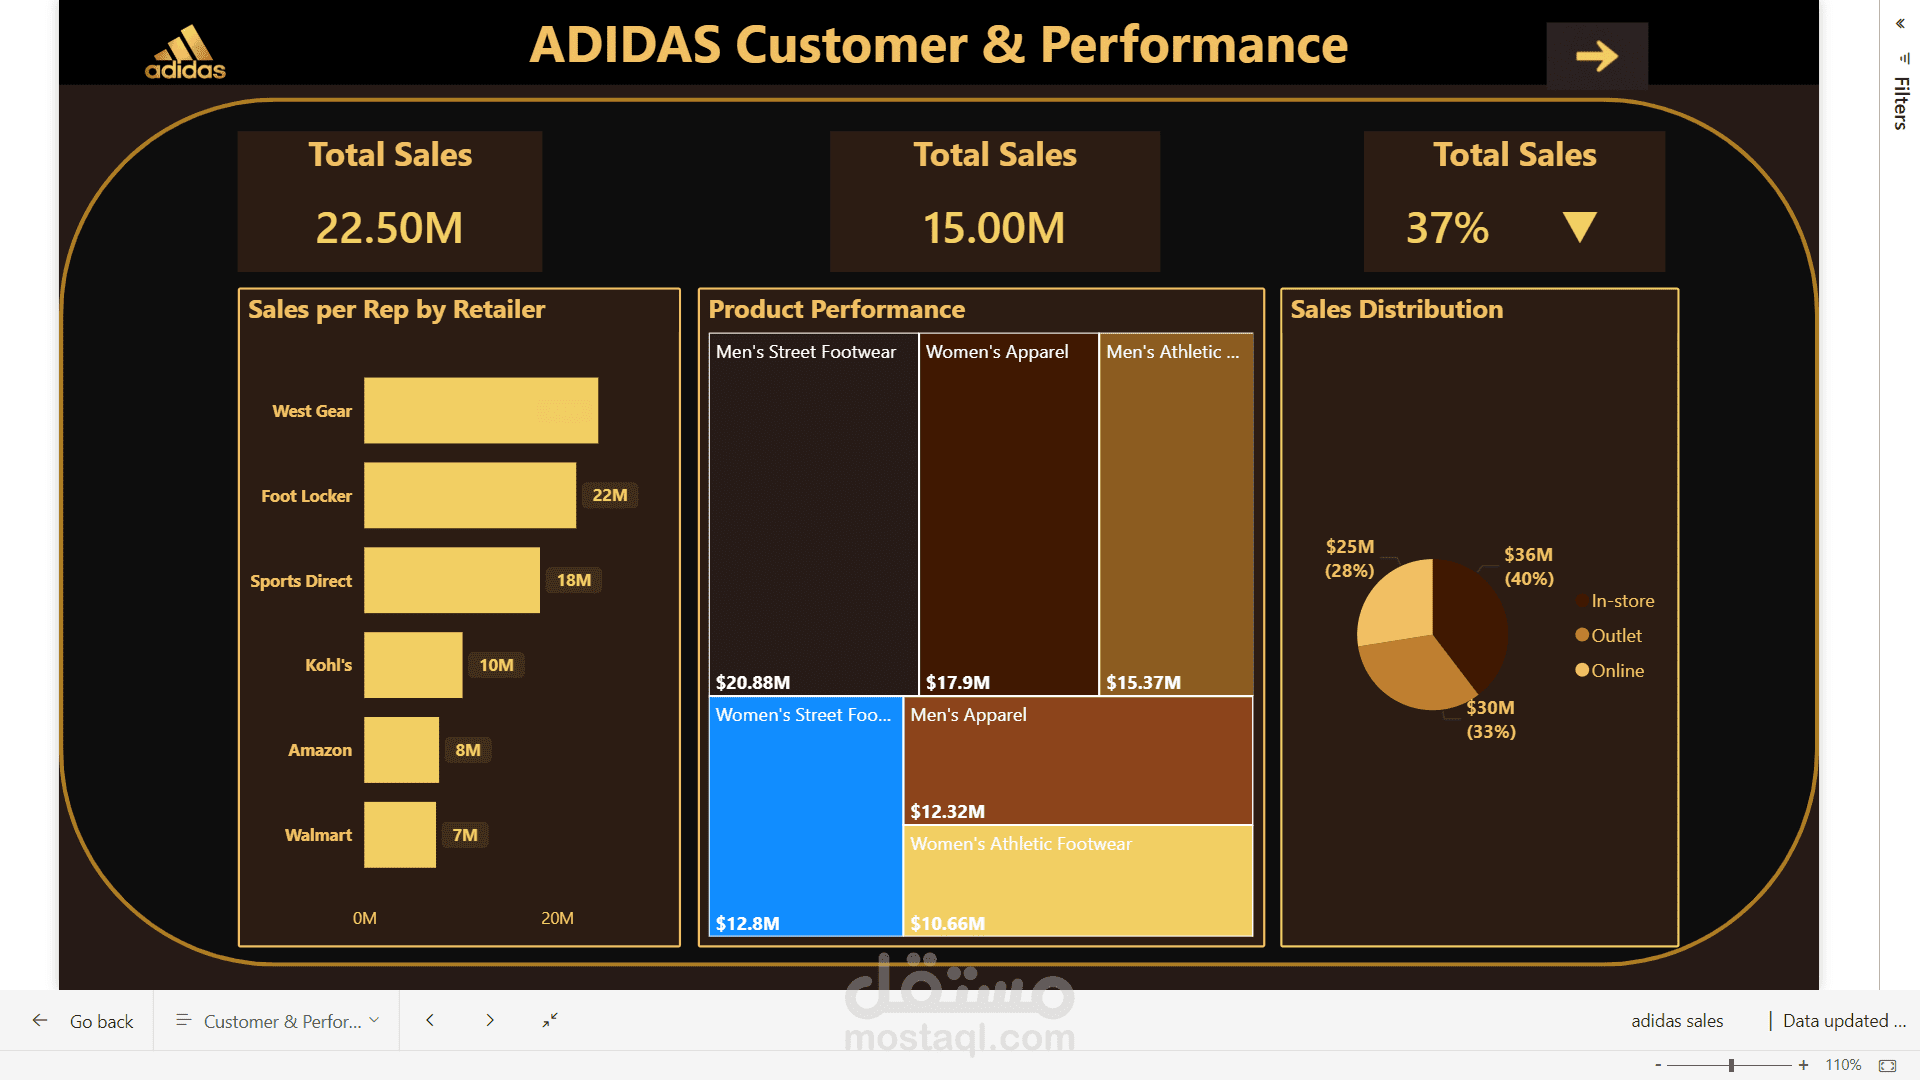
• Sales per Representative
• Customer Lifetime Value
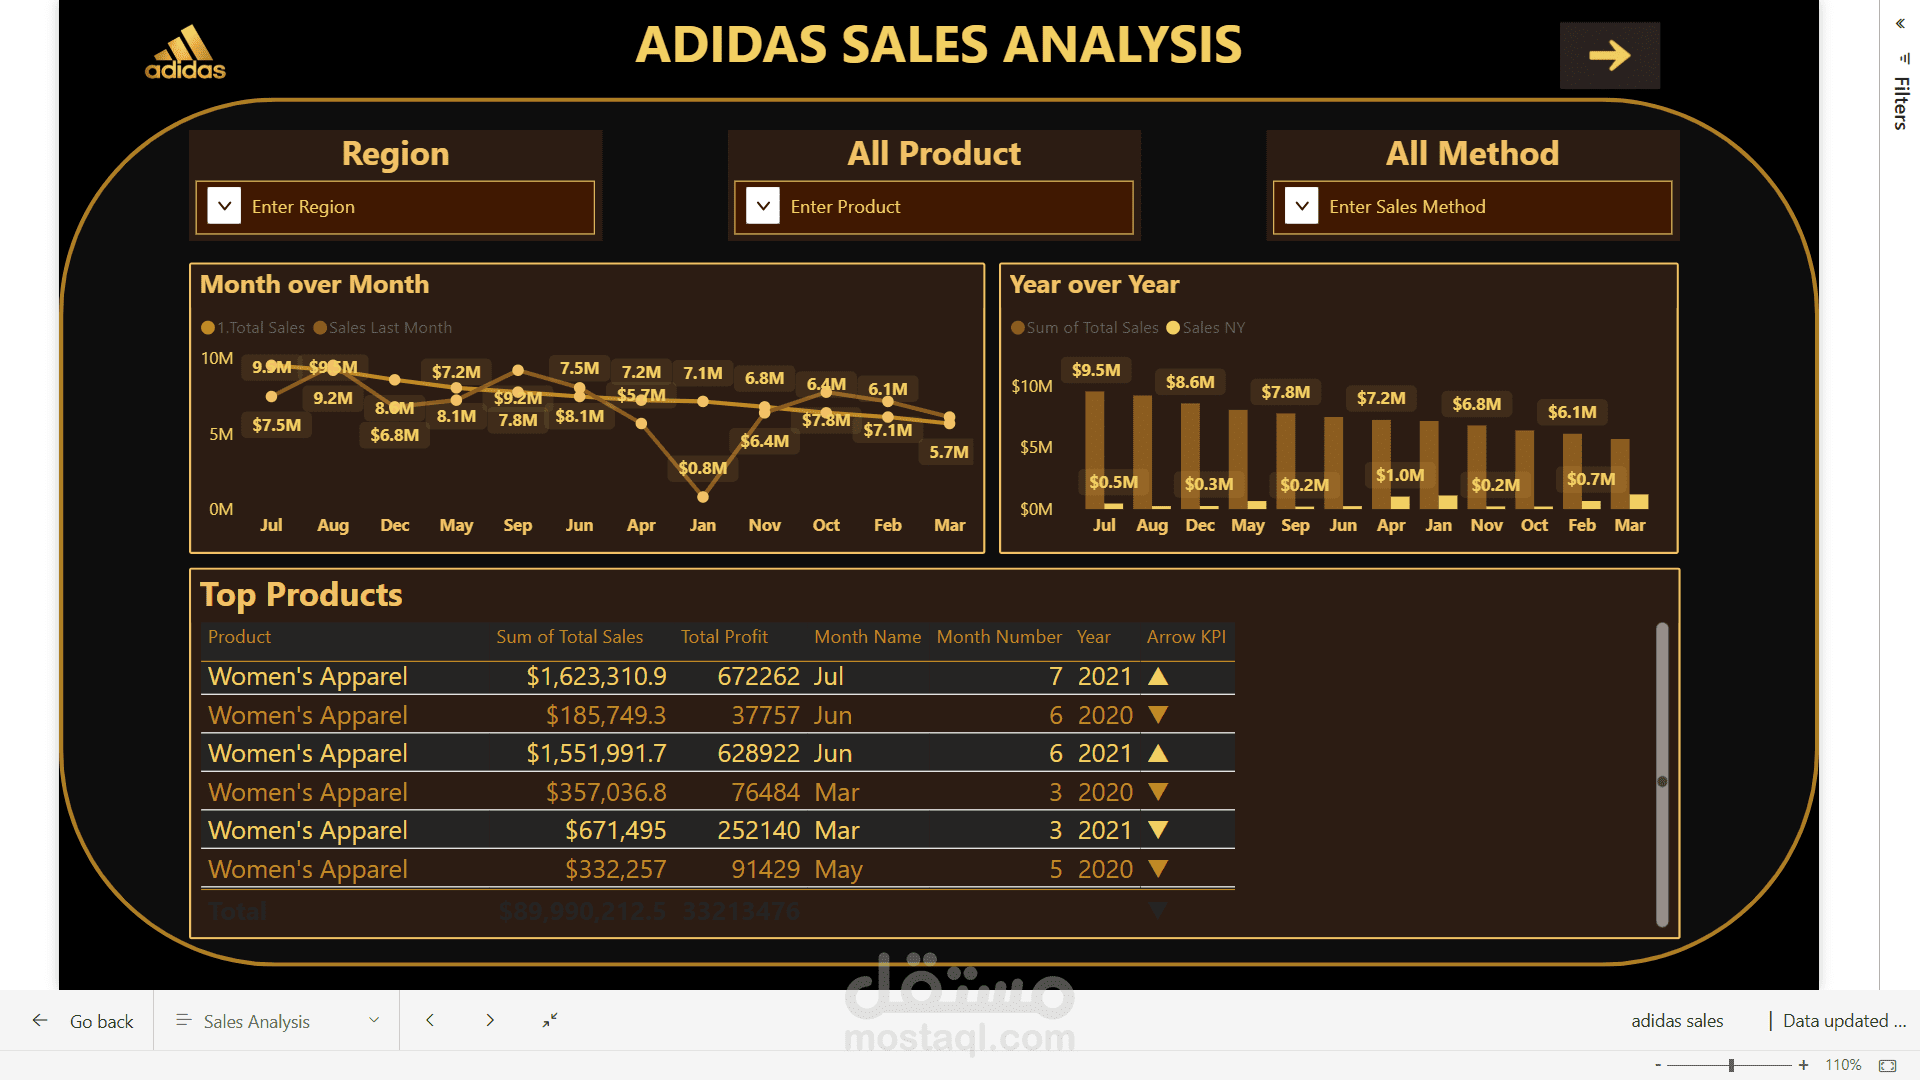
* Month-over-Month (MoM) and Year-over-Year (YoY) analysis
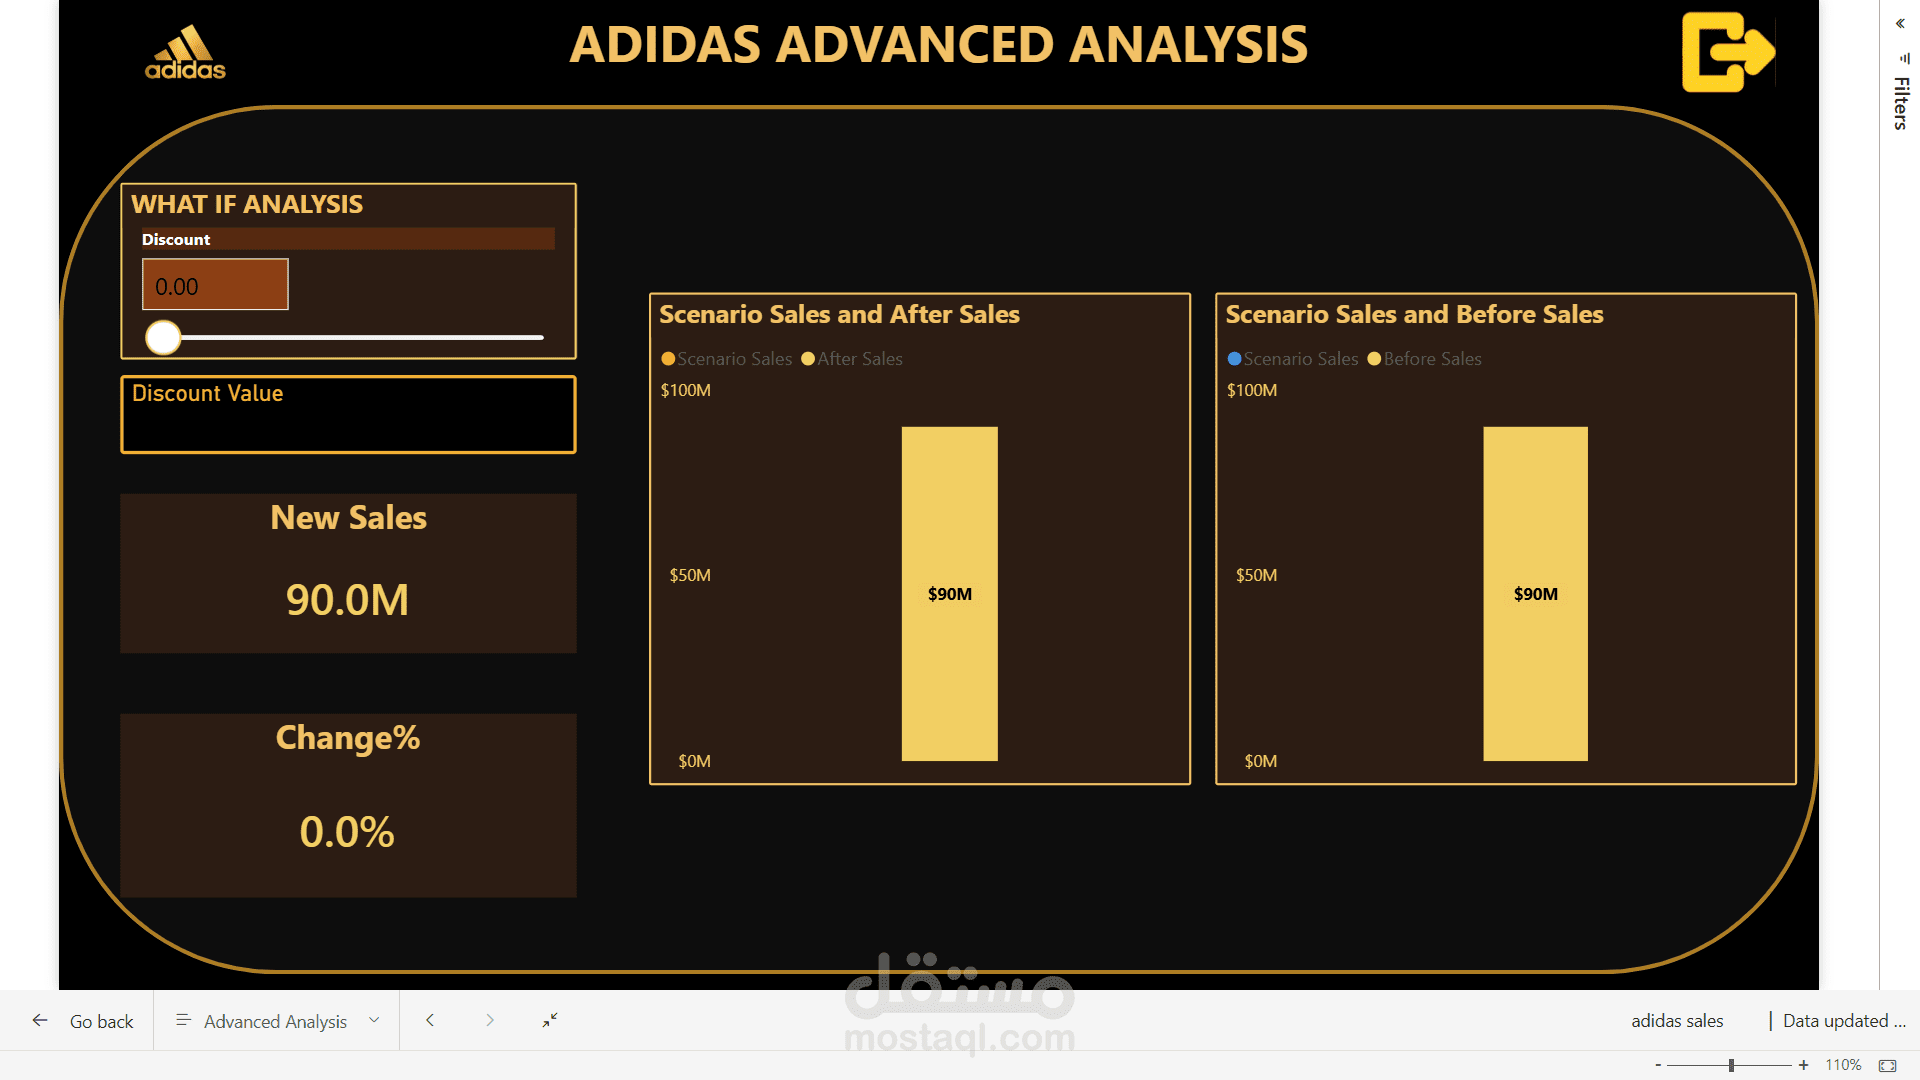
* What-If Analysis to simulate the impact of discounts on sales
* Fully interactive dashboard with dynamic filtering
? Advanced Techniques:
* DAX measures for complex calculations
* Conditional Formatting for performance highlighting
* Drill-through for detailed analysis
* UNICHAR indicators (⬆ ⬇) for trend visualization
? Business Impact:
This dashboard transforms raw data into clear insights that help:
* Improve pricing strategies
* Monitor product performance
* Understand customer behavior
* Identify growth opportunities
? Tools Used:
Power BI | DAX | Excel
? This project demonstrates my ability to turn data into meaningful and actionable insights.
? Available for freelance data analysis and dashboard development projects.