Restaurant performance overview Dashboard
تفاصيل العمل
Restaurant Performance Dashboard | Data Analysis Project
This project is an end-to-end data analytics solution focused on analyzing restaurant performance and transforming raw data into actionable insights.
I worked with a large dataset of over 11 million records collected from multiple sources (Excel and JSON). Using Databricks, I cleaned, combined, and transformed the data into a unified dataset, and created additional columns to support time-based analysis.
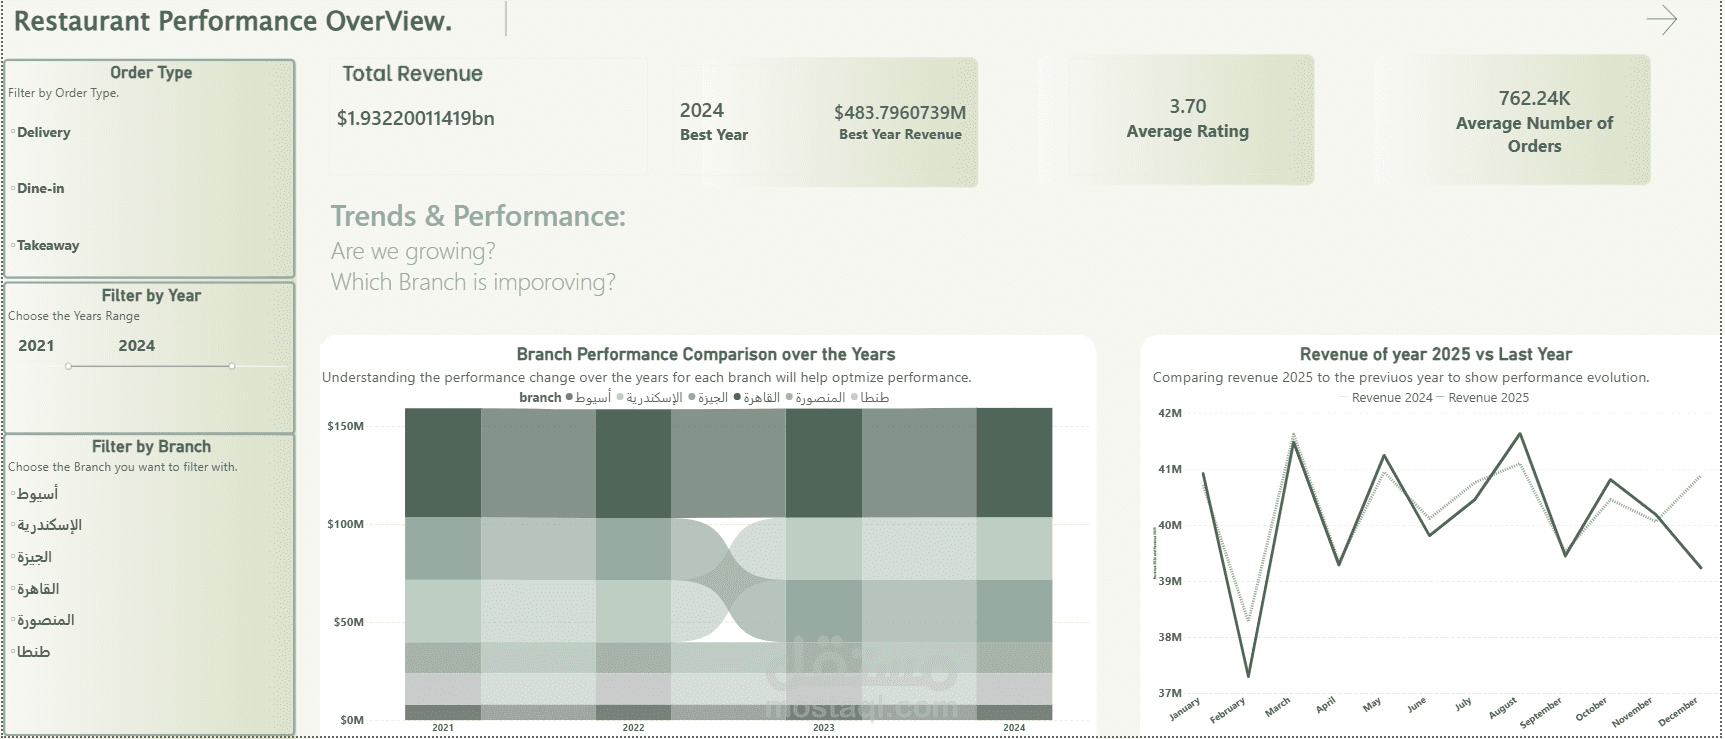
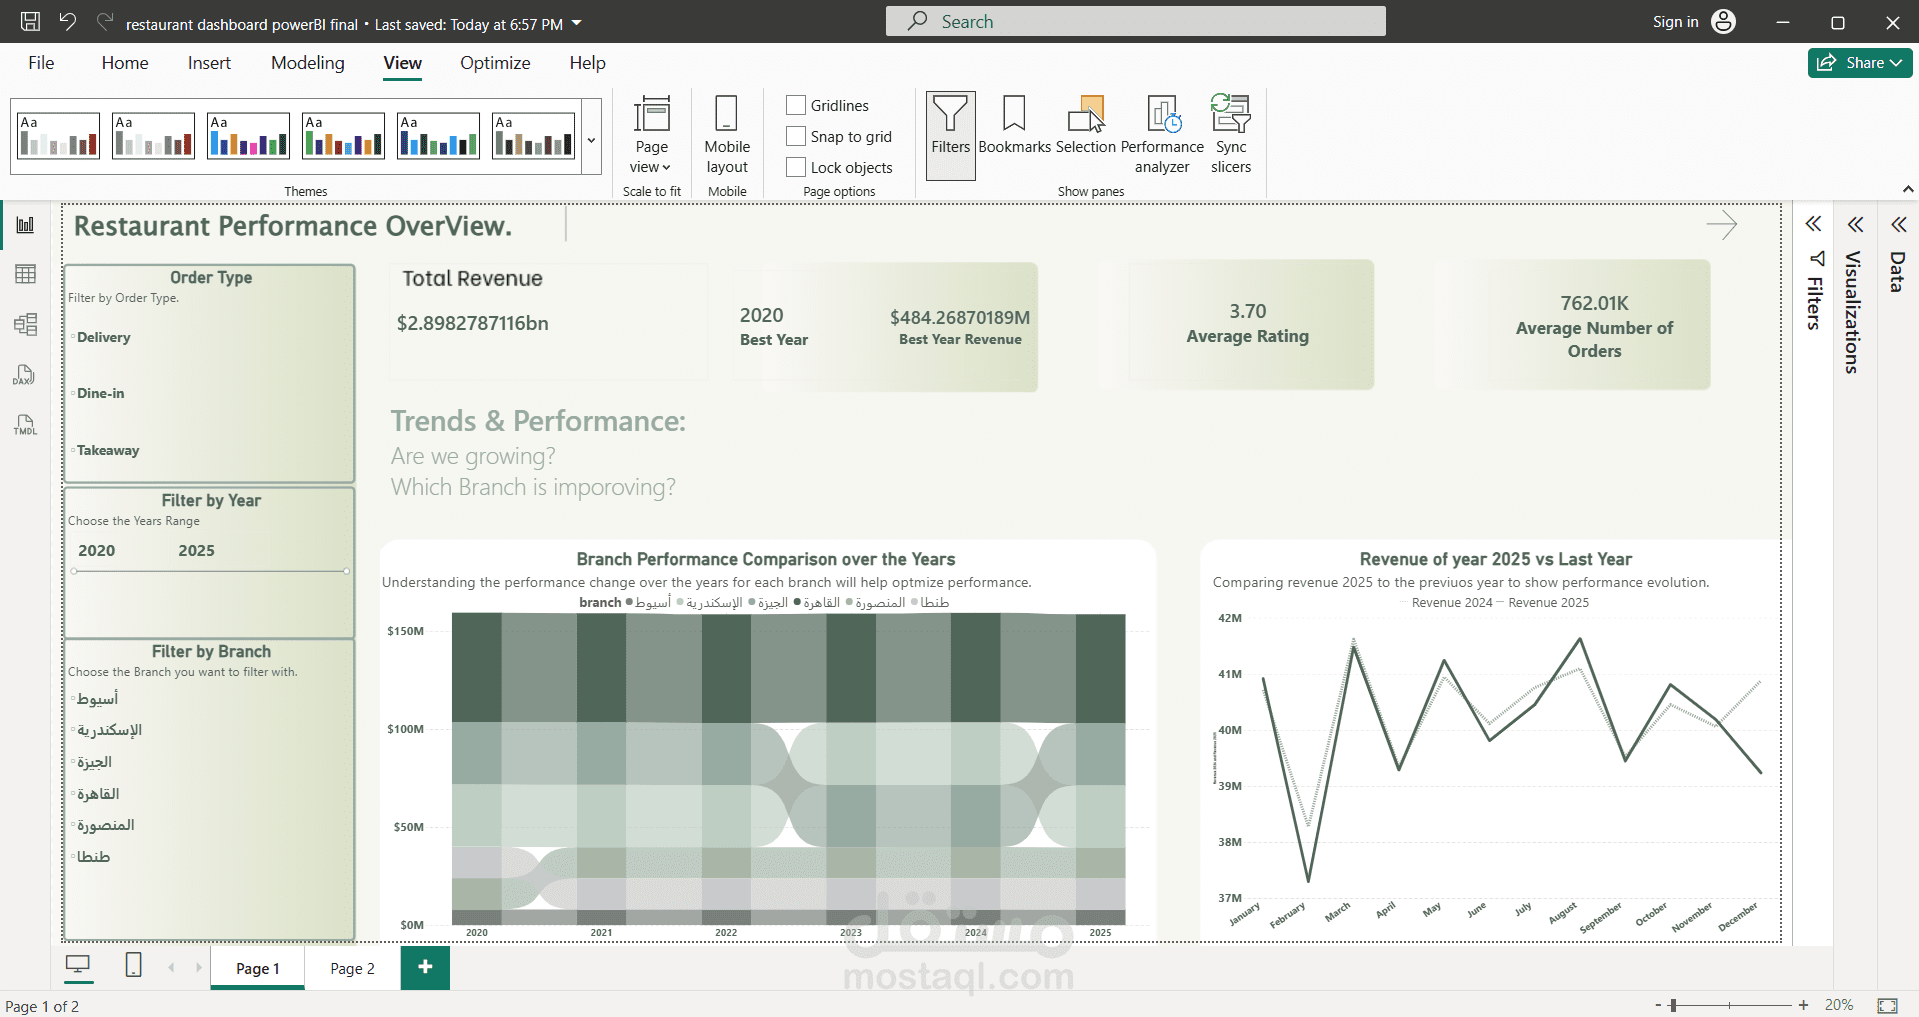
After preparing the data, I built an interactive dashboard using Power BI to provide clear insights, including:
* Overall performance (Revenue, Orders, Ratings)
* Revenue trends and year-over-year comparison
* Branch performance across locations
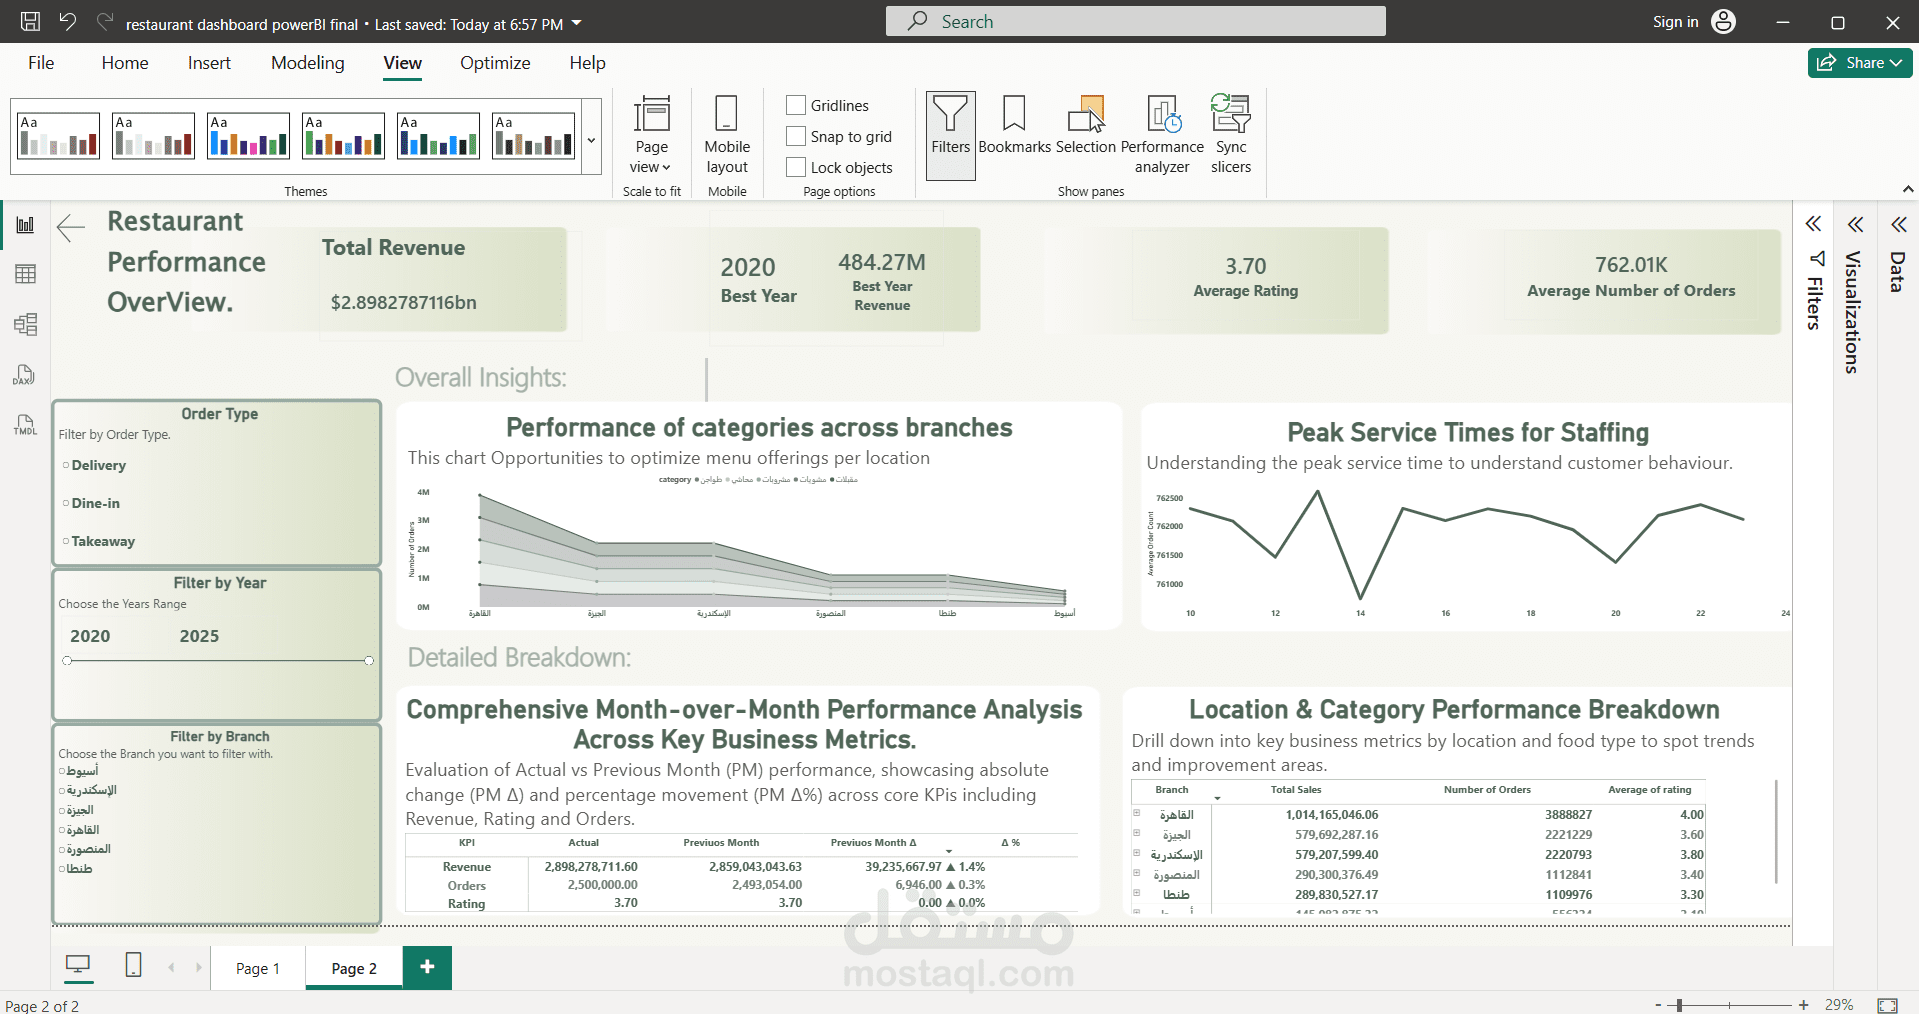
* Category analysis to identify top-performing items
* Peak service times to better understand customer behavior
This project demonstrates my ability to work with large-scale datasets, perform data transformation, and design clear, structured dashboards that support decision-making.
لوحة تحليل أداء المطاعم | مشروع تحليل بيانات
هذا المشروع هو حل متكامل لتحليل البيانات يهدف إلى دراسة أداء المطاعم وتحويل البيانات الخام إلى رؤى واضحة تساعد في اتخاذ القرارات.
عملت على مجموعة بيانات كبيرة تتجاوز 11 مليون سجل تم جمعها من مصادر متعددة مثل Excel وJSON. باستخدام Databricks، قمت بتنظيف البيانات ودمجها وتحويلها إلى قاعدة بيانات موحدة، بالإضافة إلى إنشاء أعمدة جديدة لدعم التحليل الزمني.
بعد تجهيز البيانات، قمت ببناء لوحة معلومات تفاعلية باستخدام Power BI لعرض أهم المؤشرات، والتي تشمل:
* الأداء العام (الإيرادات، عدد الطلبات، التقييمات)
* اتجاهات الإيرادات والمقارنة السنوية
* أداء الفروع في مختلف المواقع
* تحليل الفئات لتحديد العناصر الأكثر أداءً
* أوقات الذروة لفهم سلوك العملاء
يوضح هذا المشروع قدرتي على التعامل مع البيانات الضخمة، وتنظيف وتحويل البيانات، وتصميم لوحات معلومات منظمة تدعم اتخاذ القرار.