provides a comprehensive
تفاصيل العمل
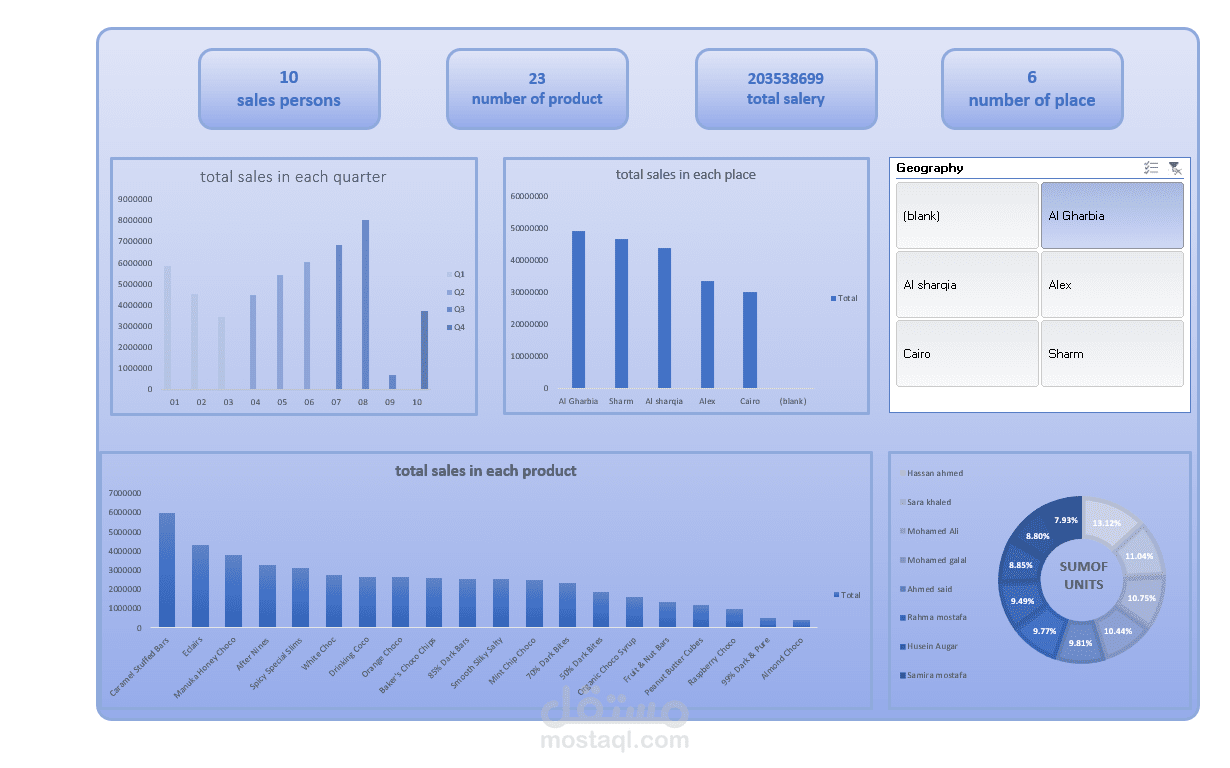
This dashboard provides a comprehensive overview of sales performance analysis, displaying the following key insights:
KPI Summary (Top Section)
Sales Persons: 10 active sales representatives
Number of Products: 23 distinct products
Total Salary: 203,538,699
Number of Places: 6 geographic locations
Charts & Visualizations
1. Total Sales in Each Quarter (Bar Chart)
Sales performance is tracked across 10 sales persons (01–10), broken down by Q1, Q2, Q3, and Q4. Sales person 08 achieved the highest total sales, while sales person 09 recorded the lowest performance, indicating a significant gap between top and bottom performers.
2. Total Sales in Each Place (Bar Chart)
Al Gharbia leads all regions with the highest sales (~50M), followed closely by Sharm and Al Sharqia. Alex and Cairo show moderate sales, while the (blank) category has the lowest contribution.
3. Total Sales in Each Product (Bar Chart)
Caramel Stuffed Bars is the top-selling product by a wide margin (~6M), followed by Eclairs and Manuka Honey Choco. Sales decline gradually across the remaining 20 products, with Almond Choco and 99% Dark & Pure being the lowest sellers.
4. Sales Representatives Share (Donut Chart)
The sales units are fairly evenly distributed among the 9 sales representatives, with Hassan Ahmed holding the largest share at 13.12%, and Mohamed Ali the smallest at 7.93%, suggesting a relatively balanced sales team performance