customer churn analysis
تفاصيل العمل
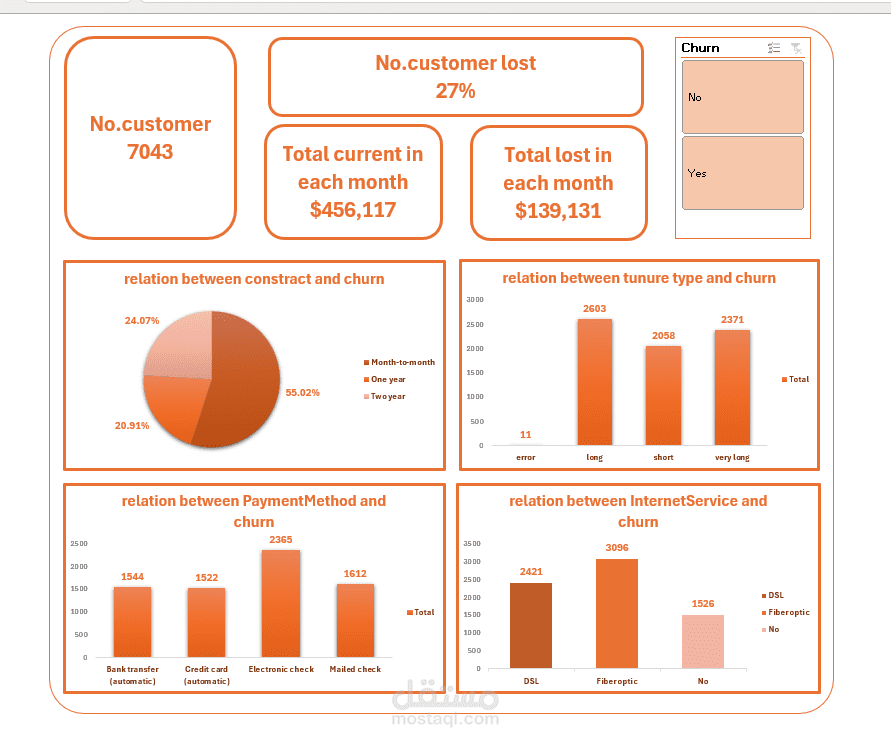
This dashboard provides a comprehensive overview of customer churn analysis for a telecom company, displaying the following key insights:
KPI Summary (Top Section)
Total Customers: 7,043
Customer Churn Rate: 27% of customers were lost
Monthly Revenue (Active Customers): $456,117
Monthly Revenue Lost (Churned Customers): $139,131
Charts & Visualizations
1. Contract Type vs. Churn (Pie Chart)
The majority of churned customers (55.02%) were on month-to-month contracts, followed by one-year (20.91%) and two-year contracts (24.07%), indicating that short-term contracts have the highest churn risk.
2. Tenure Type vs. Churn (Bar Chart)
Customers with short and long tenure show the highest churn numbers (2,058 and 2,603 respectively), while customers with "error" tenure are the least (only 11).
3. Payment Method vs. Churn (Bar Chart)
Customers paying via Electronic Check have the highest churn count (2,365), suggesting dissatisfaction or inconvenience with this payment method.
4. Internet Service vs. Churn (Bar Chart)
Fiber Optic users have the highest churn rate (3,096), which may indicate service quality or pricing issues compared to DSL (2,421) and customers with no internet service (1,526).