Analyzing Conflict Dynamics in the Syrian Revolution (
تفاصيل العمل
Project Overview
I designed and developed a data-driven analytical platform to study conflict dynamics in the Syrian Revolution from 2017 to the present, focusing on uncovering temporal and geographic patterns of violence.
The project leverages structured conflict datasets to transform raw event-level data into meaningful insights about how the war evolved over time and across regions.
The system enables:
Trend analysis of conflict events and fatalities over time
Geospatial analysis of affected regions (governorates and districts)
Correlation analysis between conflict intensity and human impact
Identification of escalation and de-escalation phases
Data storytelling combining quantitative results with historical context
At its core, the project bridges data science with real-world geopolitical analysis, turning large-scale conflict data into interpretable insights.
My Role
I led the full lifecycle of the project, including:
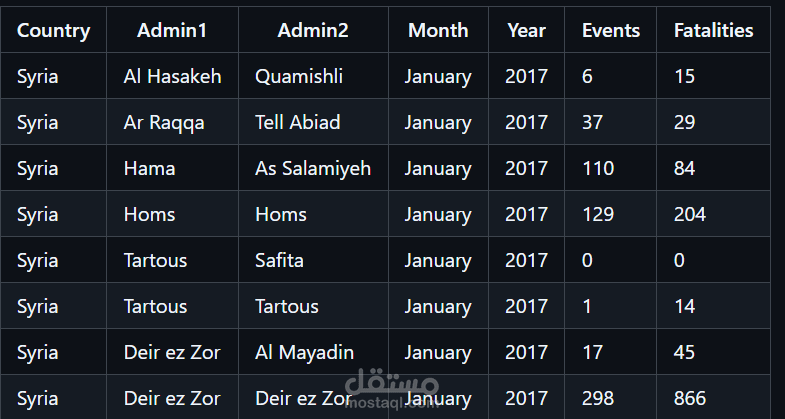
Data acquisition and validation (ACLED dataset via HDX)
Data modeling and preprocessing pipeline design
Exploratory data analysis (EDA) and statistical investigation
Visualization design for temporal and geographic insights
Analytical framework development for conflict pattern interpretation
Narrative integration to connect data findings with real-world context
This project was built as a structured analytical system, not just a set of charts.
Architecture & Approach
The system follows a structured data analysis pipeline:
Raw data ingestion (ACLED conflict dataset)
Data cleaning and normalization
Feature extraction (time, location, event metrics)
Exploratory analysis (trends, distributions, correlations)
Visualization layer (time-series, geographic heatmaps, comparisons)
Insight generation and interpretation
A key design principle was combining quantitative rigor with contextual understanding, ensuring that the analysis reflects both statistical patterns and real-world implications.
Tech Stack & Tools
Data Analysis: Python (Pandas, NumPy)
Visualization: Matplotlib, Seaborn (and/or Plotly if used)
Data Source: ACLED (via Humanitarian Data Exchange)
Data Format: Structured tabular datasets (CSV)
Analysis Style: Statistical + exploratory + interpretative
Key Analytical Contributions
1. Temporal Conflict Analysis
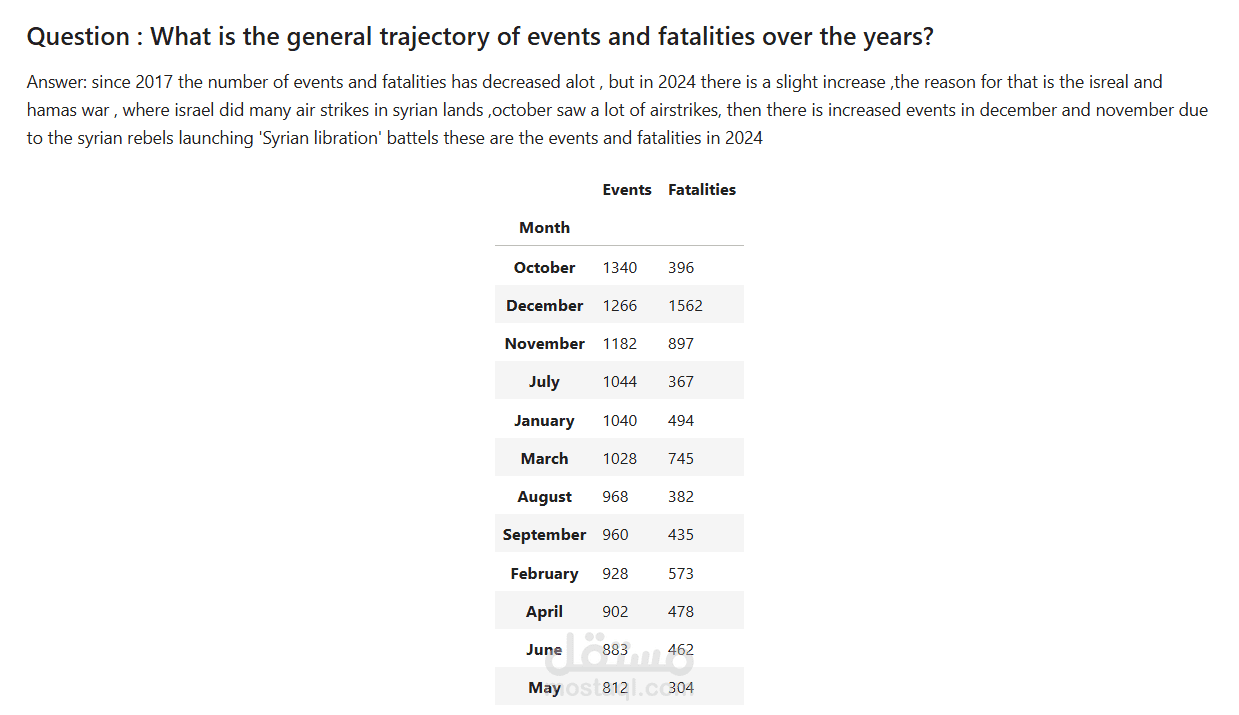
Developed time-series models to analyze how conflict evolved over months and years:
Identified peaks and declines in violence intensity
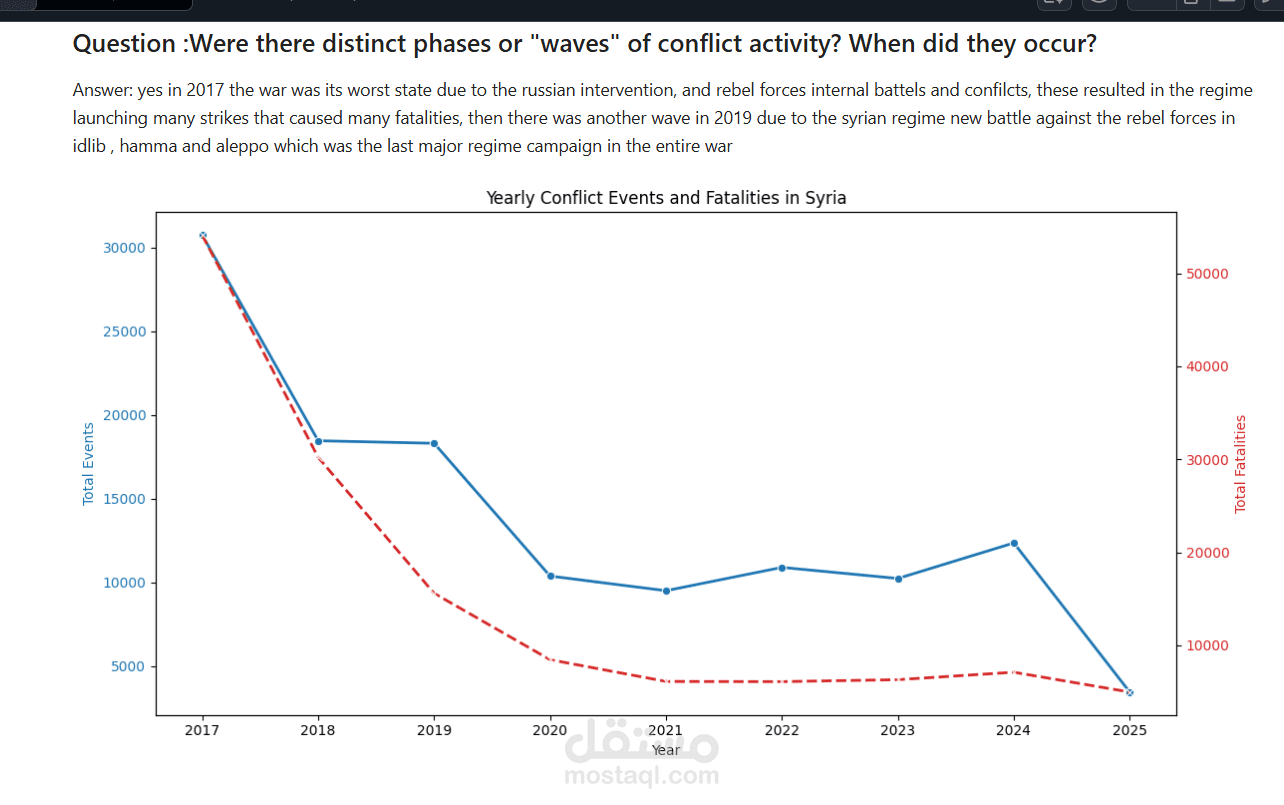
Detected phases of escalation and stabilization
Highlighted critical periods with highest fatality rates
This provides a timeline-based understanding of how the conflict changed.
2. Geographic Impact Mapping
Built spatial analysis across multiple administrative levels:
Governorate-level (Admin1) impact comparison
District-level (Admin2) granular analysis
Identification of high-intensity conflict zones
This reveals how violence was distributed across Syria and how it shifted geographically over time.
3. Events vs Fatalities Correlation
Analyzed the relationship between:
Number of events
Number of fatalities
Key insights include:
Regions with high event frequency but lower fatality rates
Regions with fewer but more lethal events
Variation in average fatalities per event across time and location
This helps differentiate between intensity and lethality of conflict.
4. Data Structuring & Feature Engineering
Designed a clean analytical dataset by:
Normalizing temporal dimensions (month/year aggregation)
Structuring geographic hierarchies (Admin1 / Admin2)
Creating derived metrics (fatalities per event, trend indicators)
This enabled reliable and repeatable analysis.
5. Insight-Driven Visualization
Created visual outputs that support decision-making and understanding:
Time-series charts for conflict trends
Comparative regional charts
Distribution plots for event intensity
Heatmaps for geographic concentration
Focus was placed on clarity, interpretability, and storytelling.
6. Contextual Interpretation Layer
Beyond raw analysis, the project integrates:
Historical context
Conflict dynamics understanding
Human impact perspective
This ensures that the data is not treated as abstract numbers, but as indicators of real-world events and consequences.
Key Strengths of the System
Strong combination of data science and geopolitical analysis
Structured, reproducible analytical pipeline
Handles real-world, noisy conflict data
Multi-dimensional analysis (time, geography, impact)
Insight-focused, not just visualization-focused
Scalable for other conflict or humanitarian datasets
Outcome
The project enables:
Understanding how conflict intensity evolved over time
Identifying the most affected regions and periods
Distinguishing between frequency and severity of violence
Supporting data-driven discussions about conflict dynamics
It effectively transforms raw conflict data into a structured analytical narrative, providing clarity on one of the most complex modern conflicts.