AI-powered Managed Services Operational Intelligence & SLA Reporting Platform
تفاصيل العمل
Project Overview
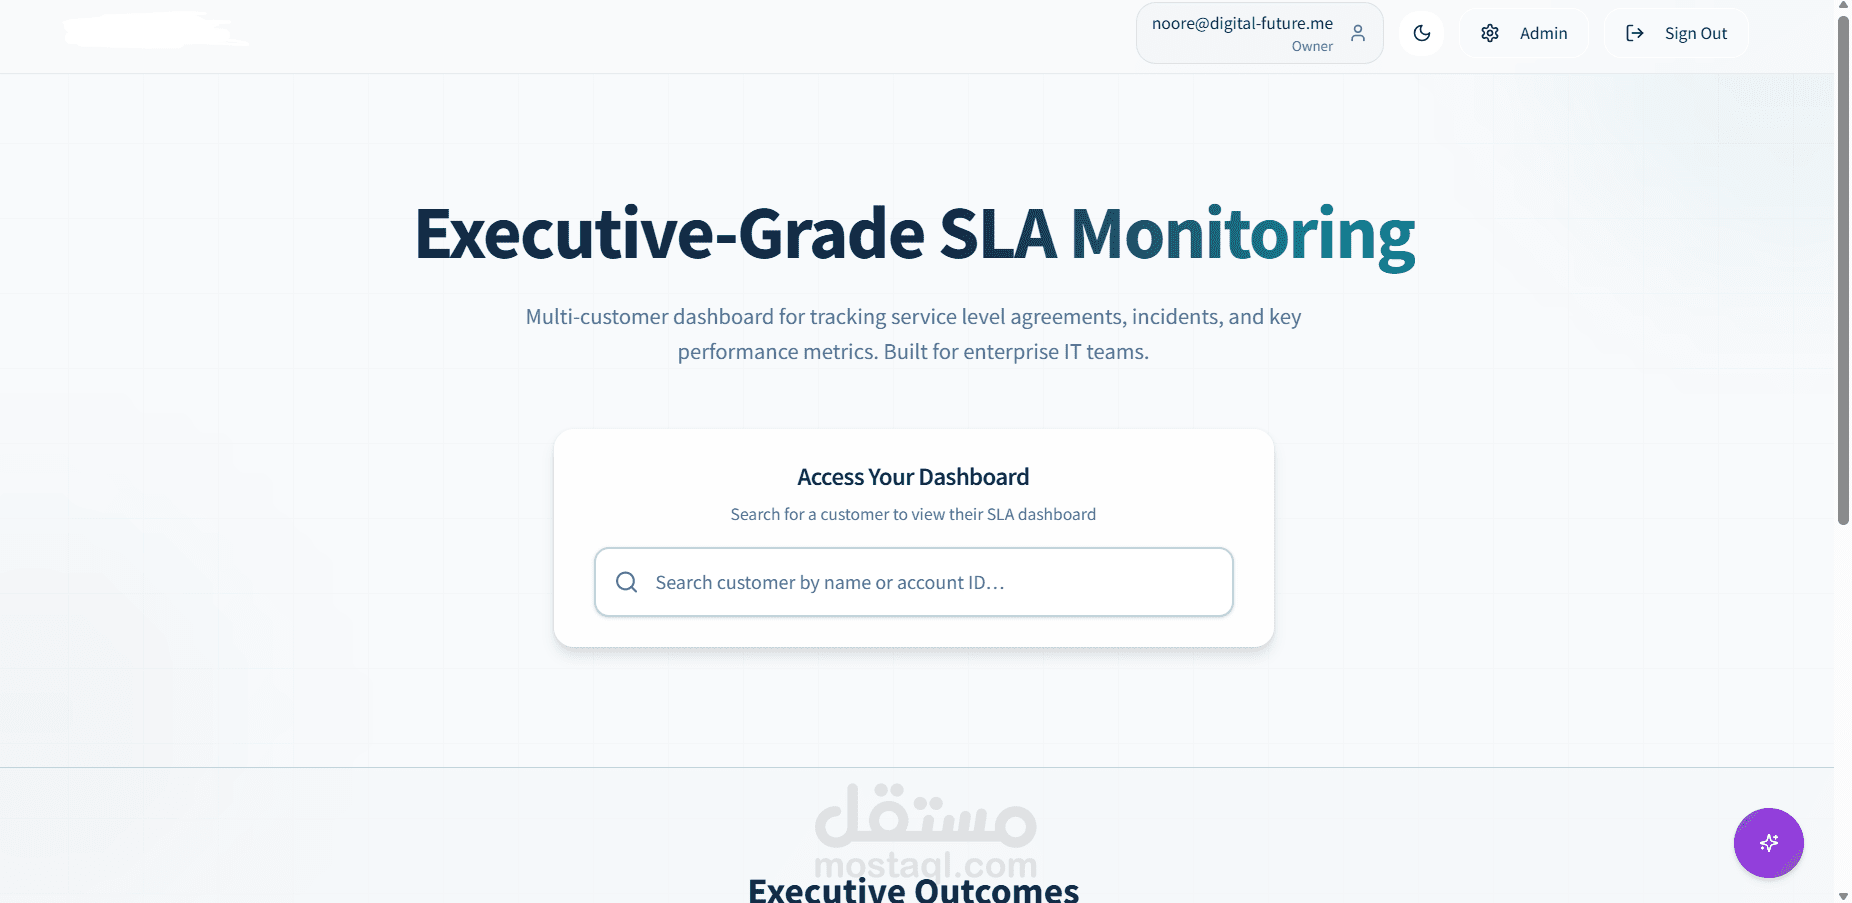
I designed and built an AI-powered Managed Services Operational Intelligence & SLA Reporting Platform that transforms raw IT service data into structured, executive-ready operational reports and insights.
The platform enables organizations to monitor, analyze, and improve their IT service delivery performance across:
Service Level Agreements (SLA)
Incident Management
Service Requests
Infrastructure Monitoring
Availability & Performance Metrics
Operational Risk & Insights
It acts as a decision-support system for MSP operations and NOC teams, converting fragmented operational data into clear, actionable intelligence through automated reporting and analytics.
At its core, the system combines data aggregation pipelines, SLA analytics, and AI-assisted insights generation to ensure both visibility and operational excellence.
My Role
I led the end-to-end design and implementation, including:
Operational data modeling and SLA KPI design
Backend analytics and reporting pipeline architecture
AI-driven insights generation (executive summaries, risks, recommendations)
Dashboard design aligned with ITIL operational standards
Integration strategy with monitoring and ticketing systems
System scalability and production-readiness decisions
This was built as a production-grade operational platform, not a static reporting tool.
Architecture & Approach
The system follows a data-driven, backend-first architecture:
Operational data ingestion (tickets, monitoring systems, SLA metrics)
Data normalization and KPI computation
SLA analytics and performance evaluation
AI-generated insights (executive summaries, highlights, risks)
Dashboard visualization and structured report generation
Continuous improvement loop (recommendations & optimization tracking)
A key design principle was bridging raw operational data with executive-level visibility, ensuring technical metrics are translated into business-relevant insights.
Tech Stack & Frameworks
Frontend: React (interactive dashboards)
Backend: Node.js / Express (analytics & API layer)
Data Sources: ServiceDesk Plus, monitoring tools (e.g., Site24x7)
AI Models: Google Vertex AI (Gemini for insights generation)
Cloud: Google Cloud Platform
Reporting: Automated structured reports (DOCX/PDF)
Data Processing: KPI engines + structured JSON pipelines
Key Engineering Contributions
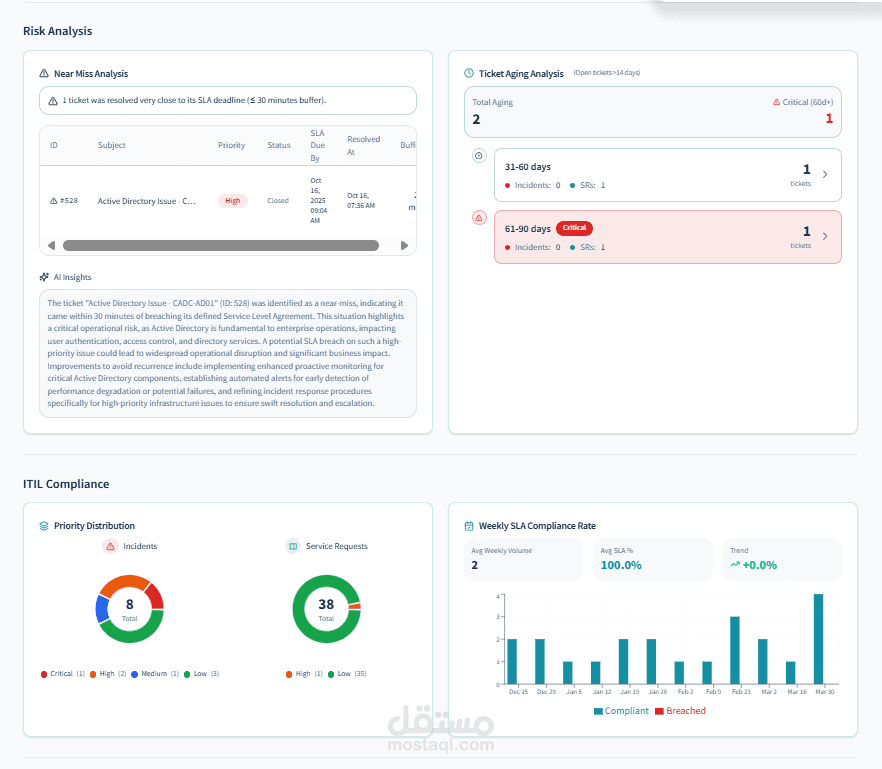
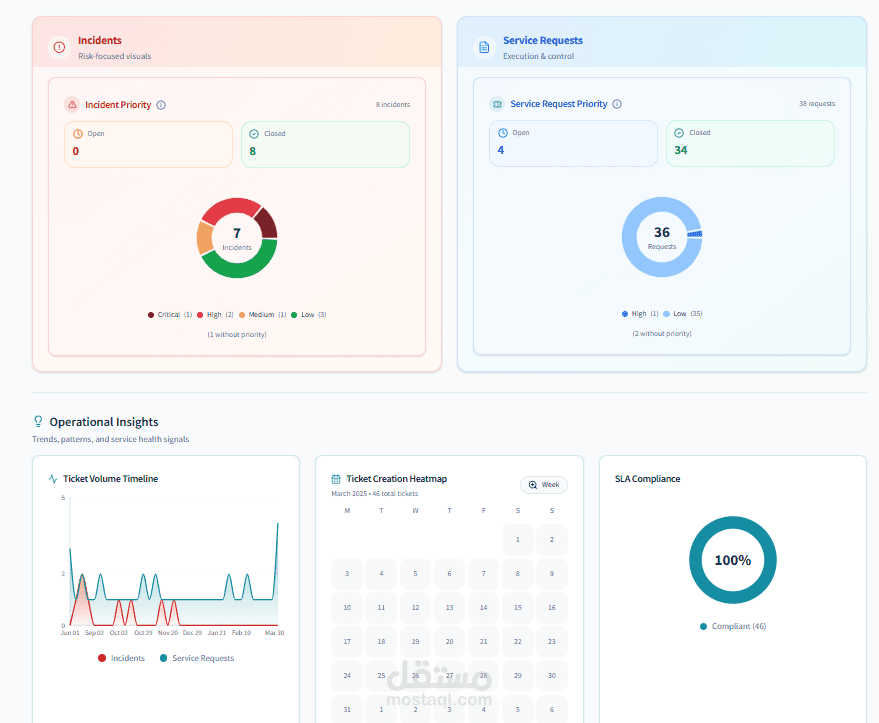
1. SLA & KPI Analytics Engine
Designed a system to compute and track critical operational KPIs, including:
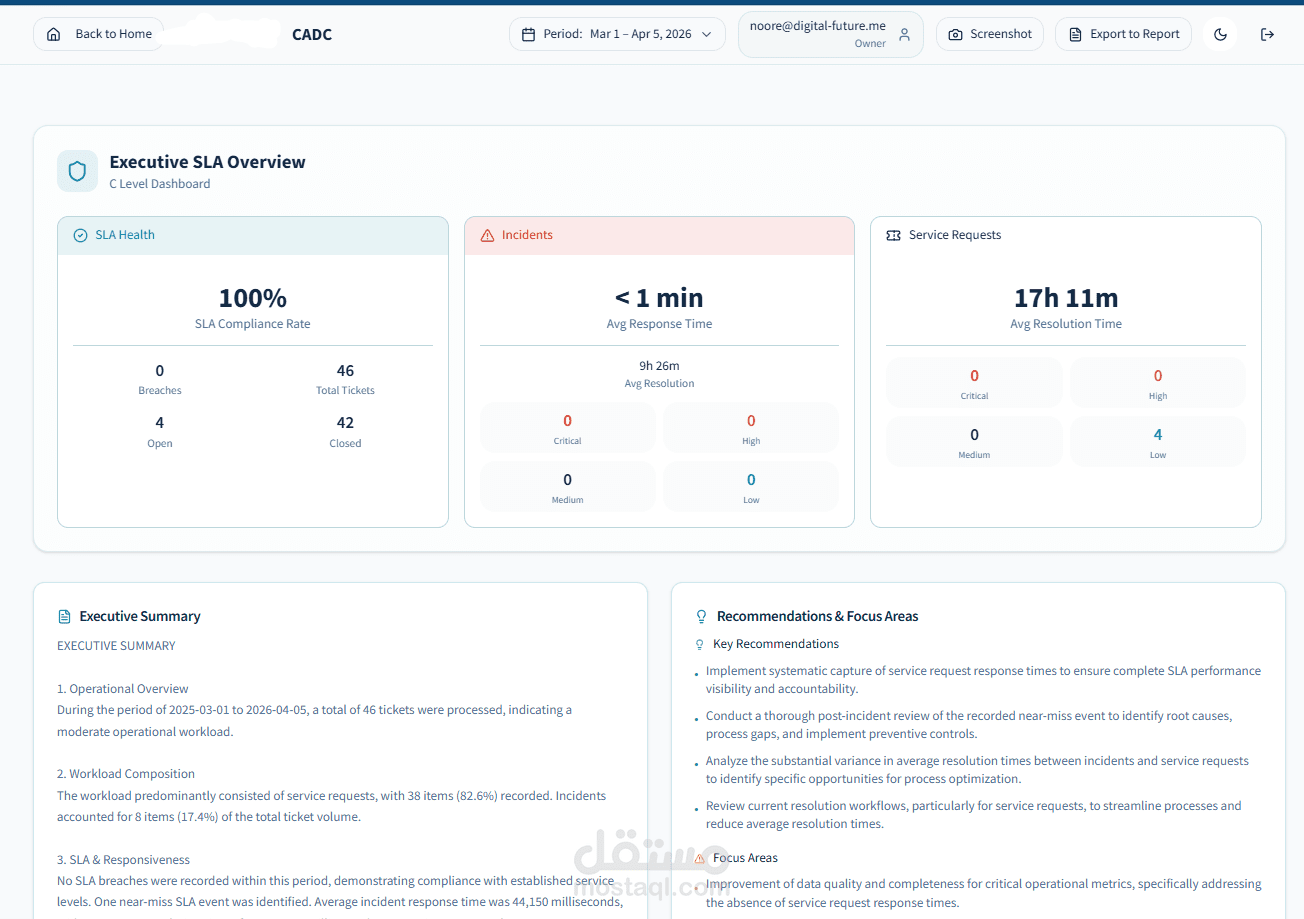
SLA compliance rates (achieved 100% in reporting scenarios)
Incident response and resolution performance
Service request lifecycle tracking
Ticket aging and backlog analysis
Priority distribution and workload balancing
This enables real-time visibility into operational health and SLA adherence.
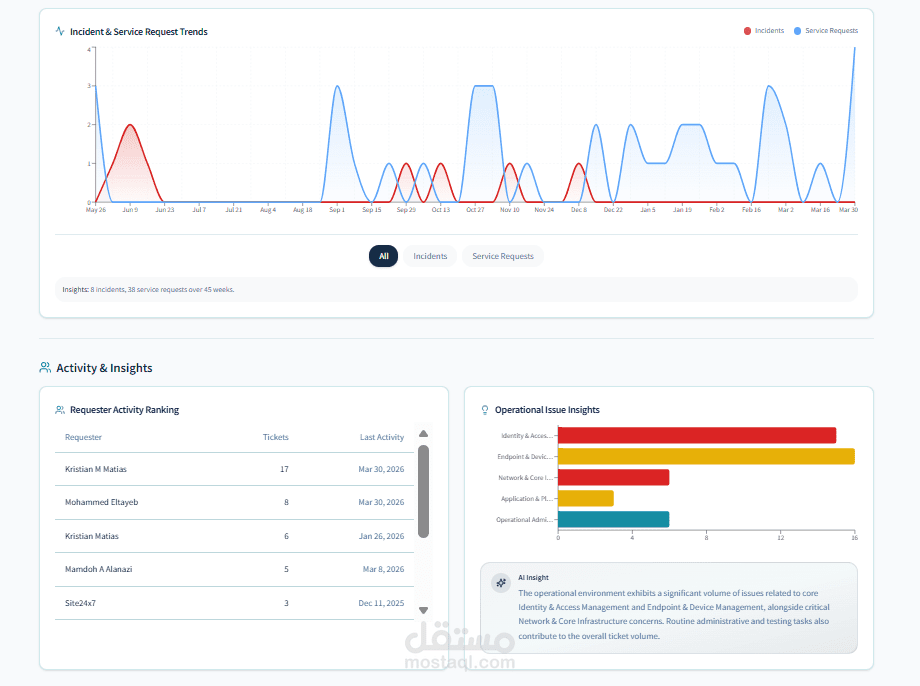
2. Operational Intelligence & Insights Layer
Built an AI-assisted insights system that automatically generates:
Executive summaries
Key highlights and achievements
Risk identification and focus areas
Actionable recommendations
For example, the system identifies patterns such as:
Near SLA breaches (near-miss analysis)
Backlog risks and aging tickets
Monitoring inefficiencies (alert noise, thresholds)
This transforms raw metrics into decision-ready intelligence.
3. Monitoring & Observability Integration
Integrated infrastructure monitoring data into the platform, covering:
VMware infrastructure
Servers and network devices
Application-level monitoring
Availability and uptime tracking (≥99.9%)
Performance metrics (CPU, memory, disk, latency)
The system also supports:
Self-healing automation insights
Alert noise reduction (~30%)
Proactive anomaly detection signals
4. Unified Operational Dashboard
Designed a structured dashboard aligned with ITIL best practices, including:
Executive SLA Dashboard
Incidents & Service Requests Overview
SLA Compliance Summary
Ticket Aging & Backlog Analysis
Priority Distribution
Performance Trends & Insights
Monitoring & Availability Views
This provides a single pane of glass for MSP operations.
5. Automated Reporting System
Built a system that generates client-ready operational reports, including:
Executive summary
SLA performance overview
Incident & service request breakdown
Monitoring and availability analysis
Risks, highlights, and recommendations
The reports are:
Structured and consistent
Business-readable (not just technical)
Aligned with enterprise MSP reporting standards
6. Proactive Operations & Optimization Design
Designed the system to support continuous operational improvement, including:
Threshold optimization for monitoring alerts
Expansion of monitoring coverage (applications, SAP, etc.)
Predictive capacity and performance insights
Automation-driven remediation (self-healing playbooks)
This shifts operations from reactive to proactive.
Key Strengths of the System
Transforms operational data into executive insights
Combines SLA analytics with AI-generated intelligence
Aligns with real-world MSP and ITIL practices
Supports proactive monitoring and automation-driven operations
Provides unified visibility across incidents, requests, and infrastructure
Scalable for multi-client managed services environments
Outcome
The platform enables organizations to:
Achieve and maintain high SLA compliance (up to 100%)
Improve incident response and resolution efficiency
Reduce operational noise and monitoring overhead
Identify risks before SLA breaches occur
Gain full visibility into infrastructure health and performance
Deliver professional, automated operational reports to stakeholders
It effectively acts as an Operational Intelligence Layer for Managed Services, combining data, analytics, and AI to elevate service delivery performance.