Power BI Sales Dashboard
تفاصيل العمل
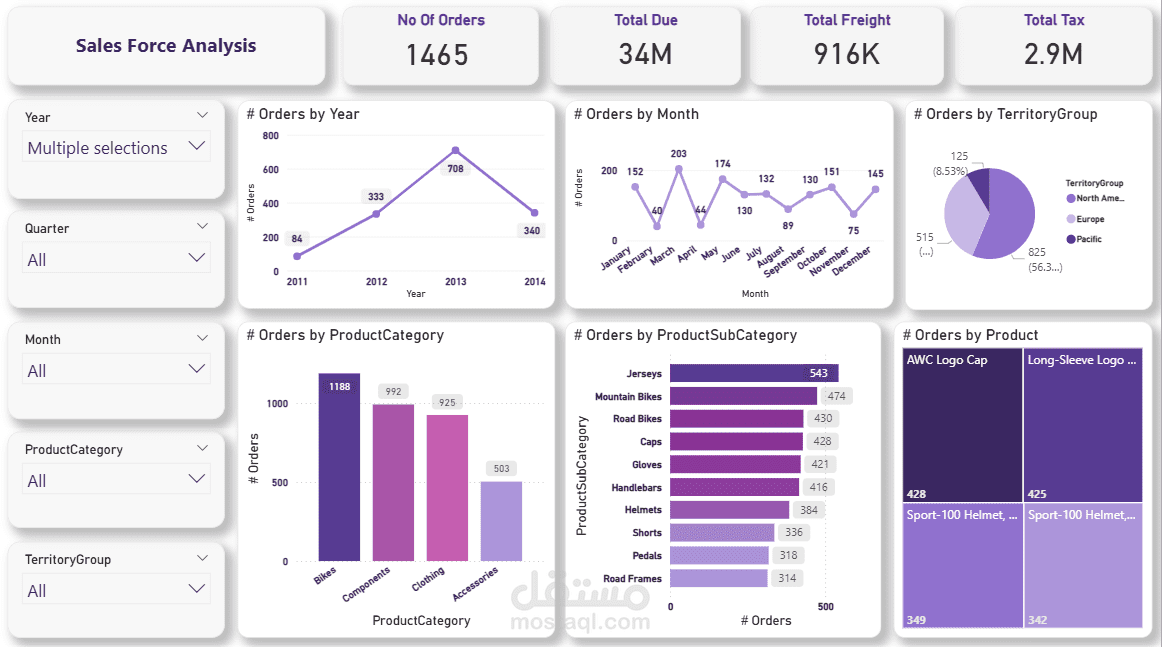
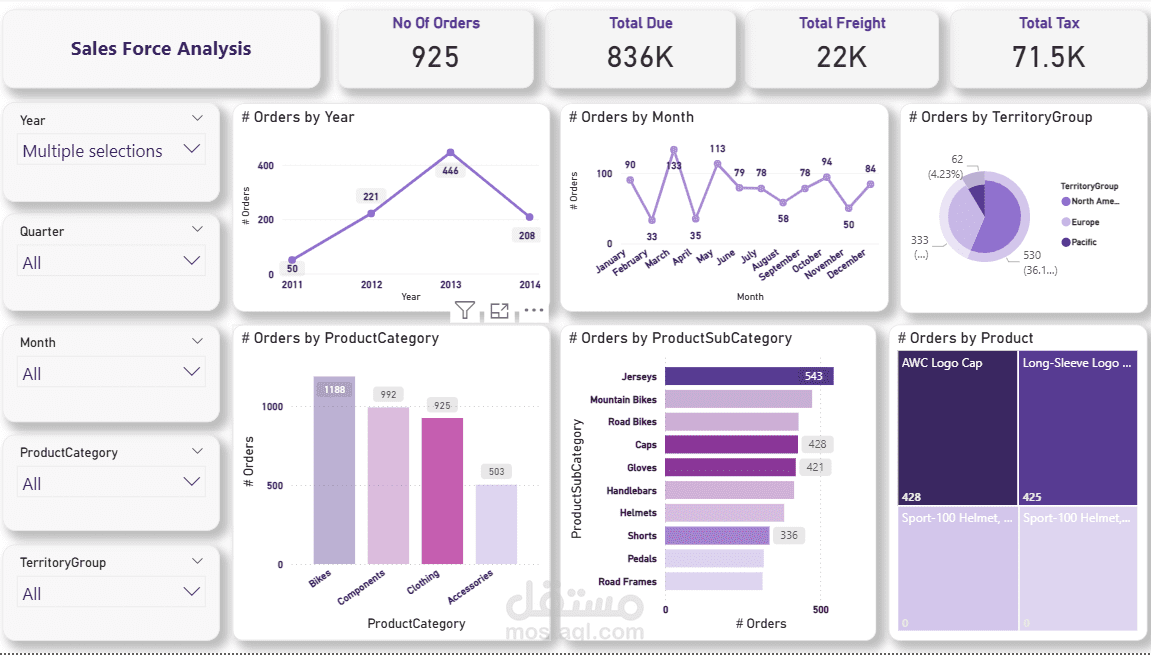
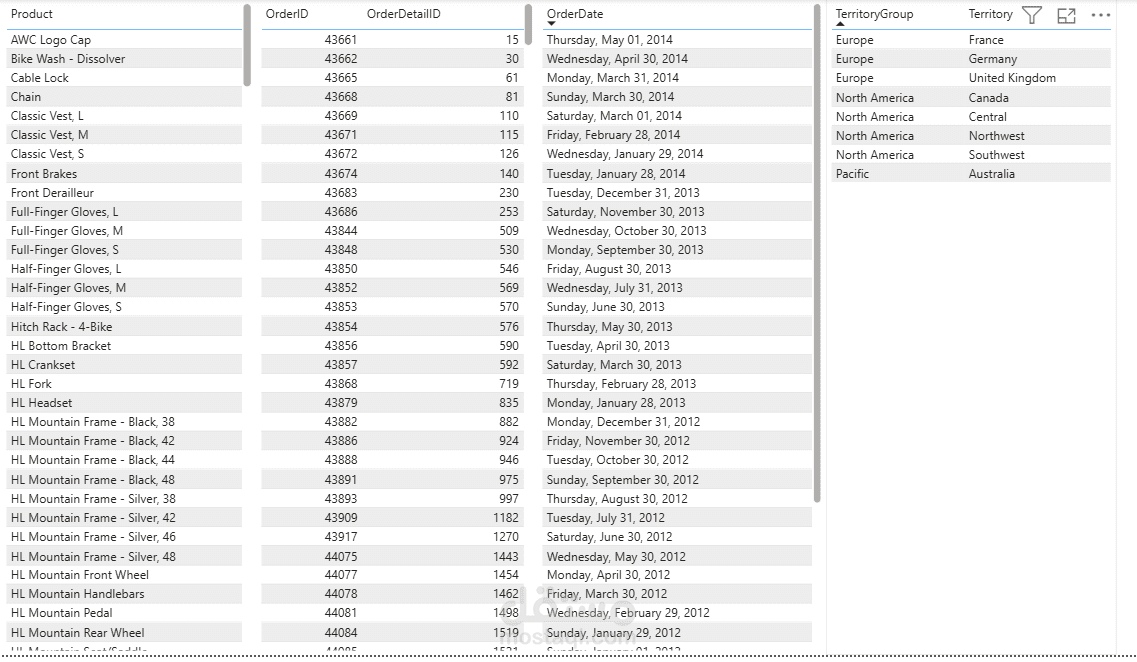
First, I performed data cleaning and preprocessing to ensure the dataset was accurate and ready for analysis. This included handling missing values, removing duplicates, and formatting columns.
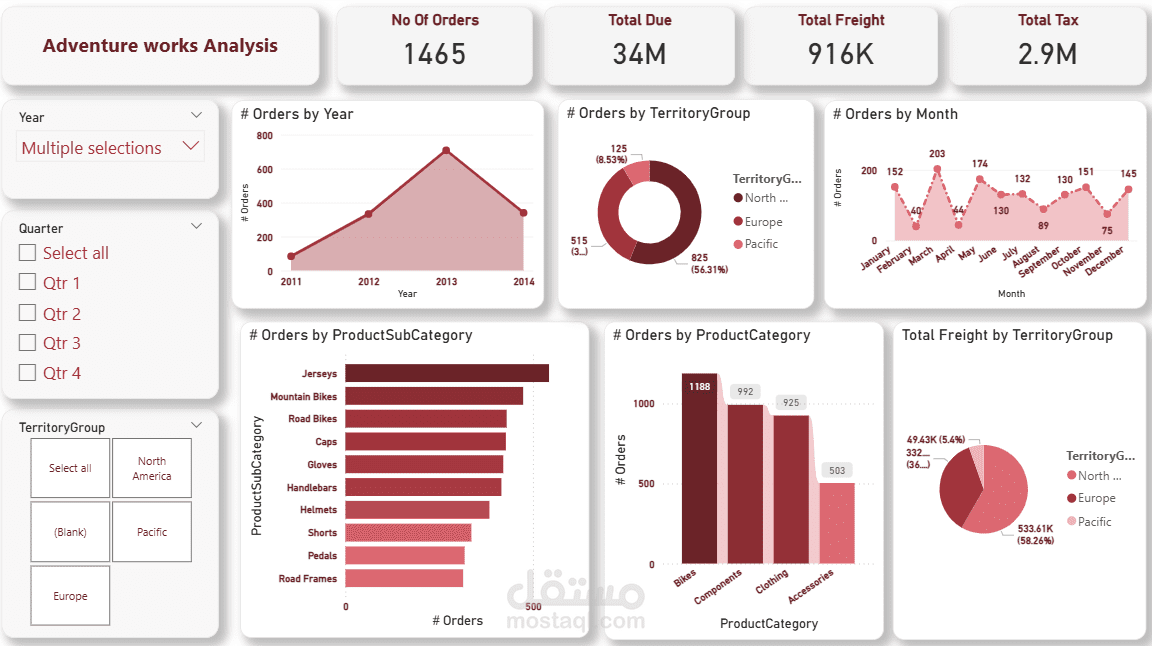
Then, I built a data model and used DAX measures to calculate key metrics such as total sales, number of orders, and other performance indicators
The dashboard includes interactive visualizations that allow users to explore trends, compare performance, and gain insights quickly. It helps stakeholders understand the data better and supports data-driven decision making