E-commerce Sales Data Analysis using Python
تفاصيل العمل

I performed a complete data analysis project on an E-commerce sales dataset using Python.
The goal of this project was to extract meaningful business insights from raw data and present them in a clear and visual way.
? What was done:
Data cleaning and preprocessing (handling missing values, removing invalid data)
Converting date columns and creating new features (month, year)
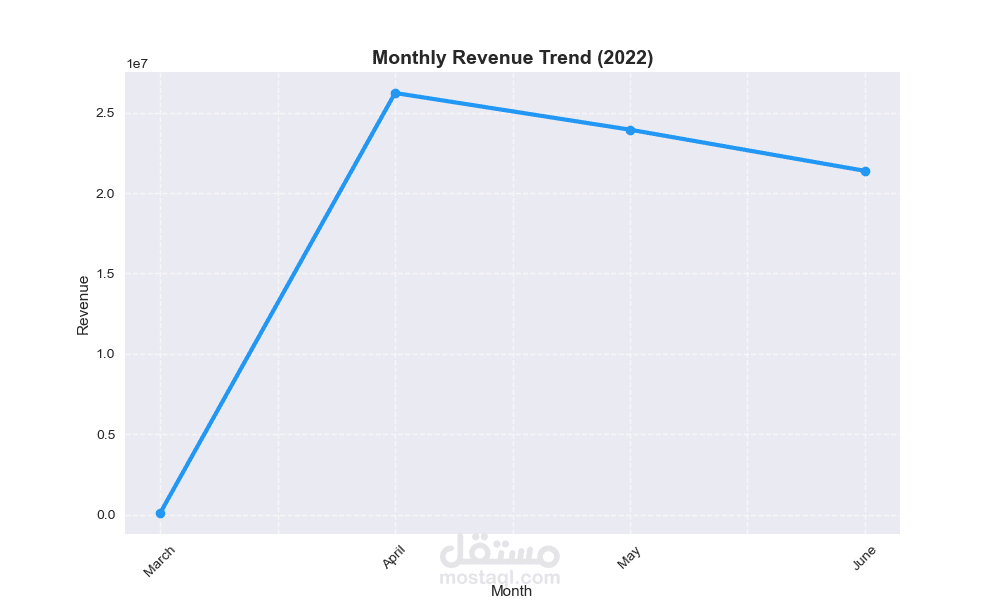
Analyzing total revenue and sales trends
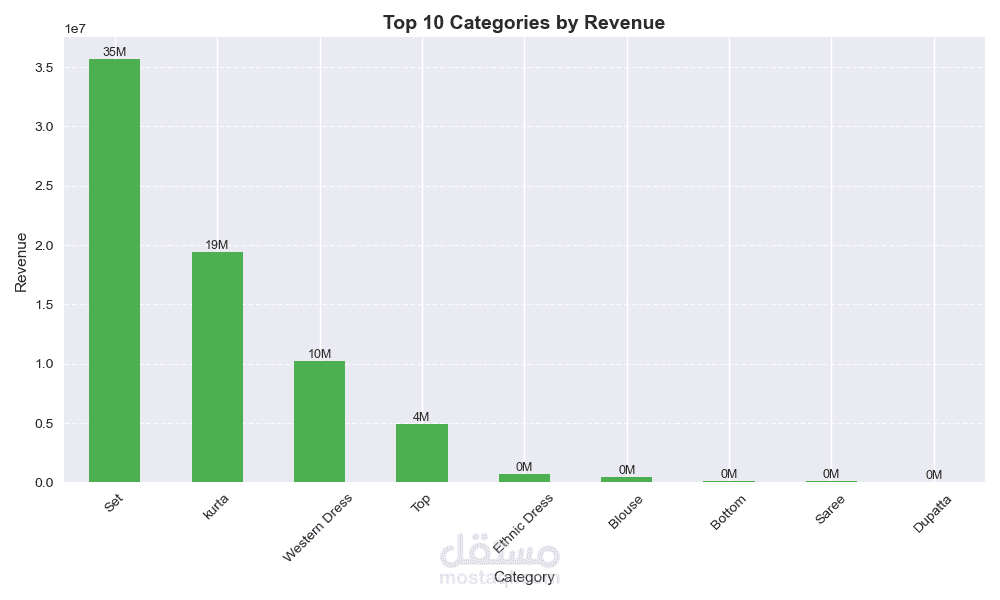
Identifying top-performing product categories
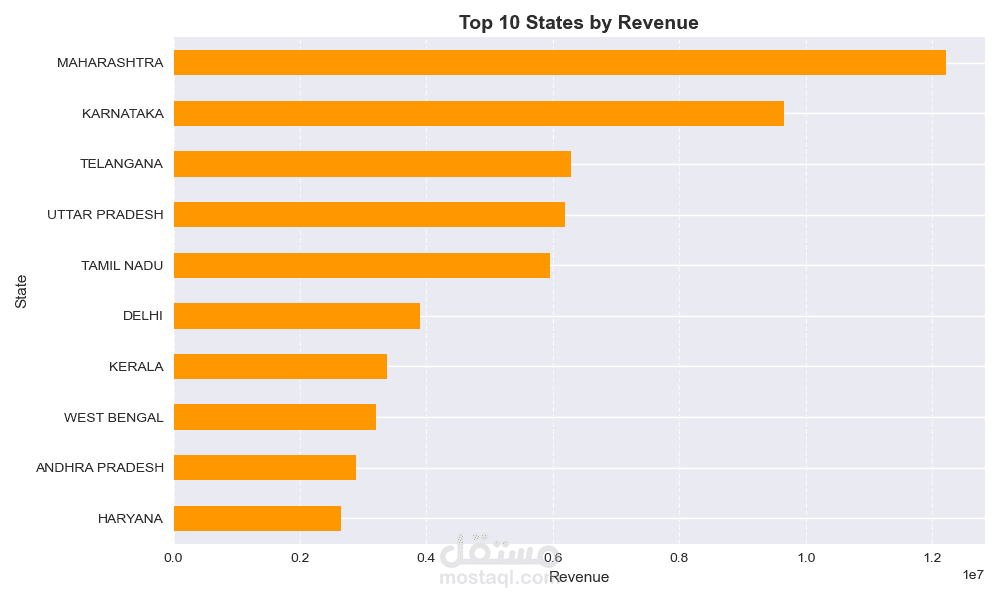
Analyzing sales distribution across different states
? Visualizations:
Monthly sales trend (line chart)
Top categories by revenue (bar chart)
Top states by revenue (horizontal bar chart)
⚙️ Tools used:
Python
Pandas
Matplotlib
? Key insights:
A few product categories generate most of the revenue
Sales showed a strong peak during specific months
Certain regions dominate overall sales performance
? Deliverables:
Clean and structured Python code
Dataset used in the analysis
High-quality visualizations
Clear business insights
? GitHub Project: