Hotel Booking Cancellation Data Analysis
تفاصيل العمل
Executive Summary & Key Results
Cancellation rate: ~27.5% overall.
Deposit & channel effects: Non‑Refund deposits have the highest cancellation probability; Online TA shows elevated cancellation rates; room types G/H carry higher risk.
Distribution by time: Cancellation probability peaks mid‑year (June–August) and is lowest in late fall/early winter.
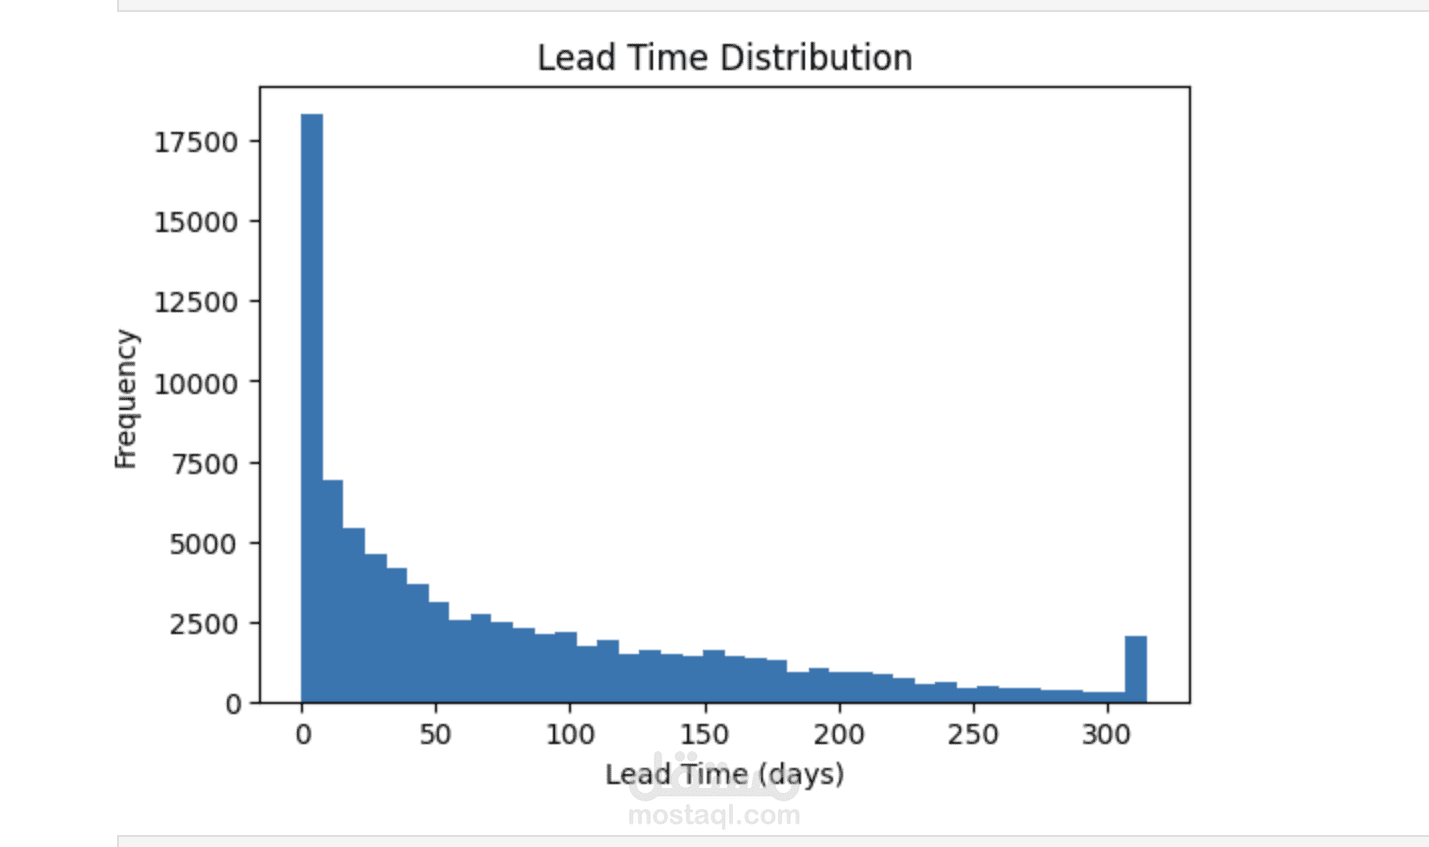
Outliers handled: ADR capped at the 99.5th percentile (~$285) and extreme lead times capped at the 98th percentile (315 days) to stabilize modeling.
Hypothesis testing:
Chi‑square: strong associations between cancellation and room type, month, market segment, deposit type (all p < 0.05).
Mann‑Whitney: significant differences (p < 0.05) for lead_time, adr, stays_in_week_nights, adults/children/babies between canceled vs. not canceled.
Probability slices:
P(cancel | deposit_type): highest for Non Refund; lowest for Refundable.
P(cancel | market_segment): highest for Online TA; lower for Corporate/Direct.
P(cancel | month): elevated in June–August, lowest in Nov/Dec.
Clusters (PCA + KMeans, k=3):
Cluster 0 (higher‑value/engaged): Higher ADR, slightly more special requests/changes; mostly Online TA.
Cluster 1 (baseline Online TA): Near‑average lead time/ADR; heavily Online TA; few prior cancellations.
Cluster 2 (higher‑risk/low‑ADR): Short lead, low ADR, more booking changes and prior cancellations; less Online TA, more Groups.