Madhav E-commerce Sales Dashboard | Power BI
تفاصيل العمل
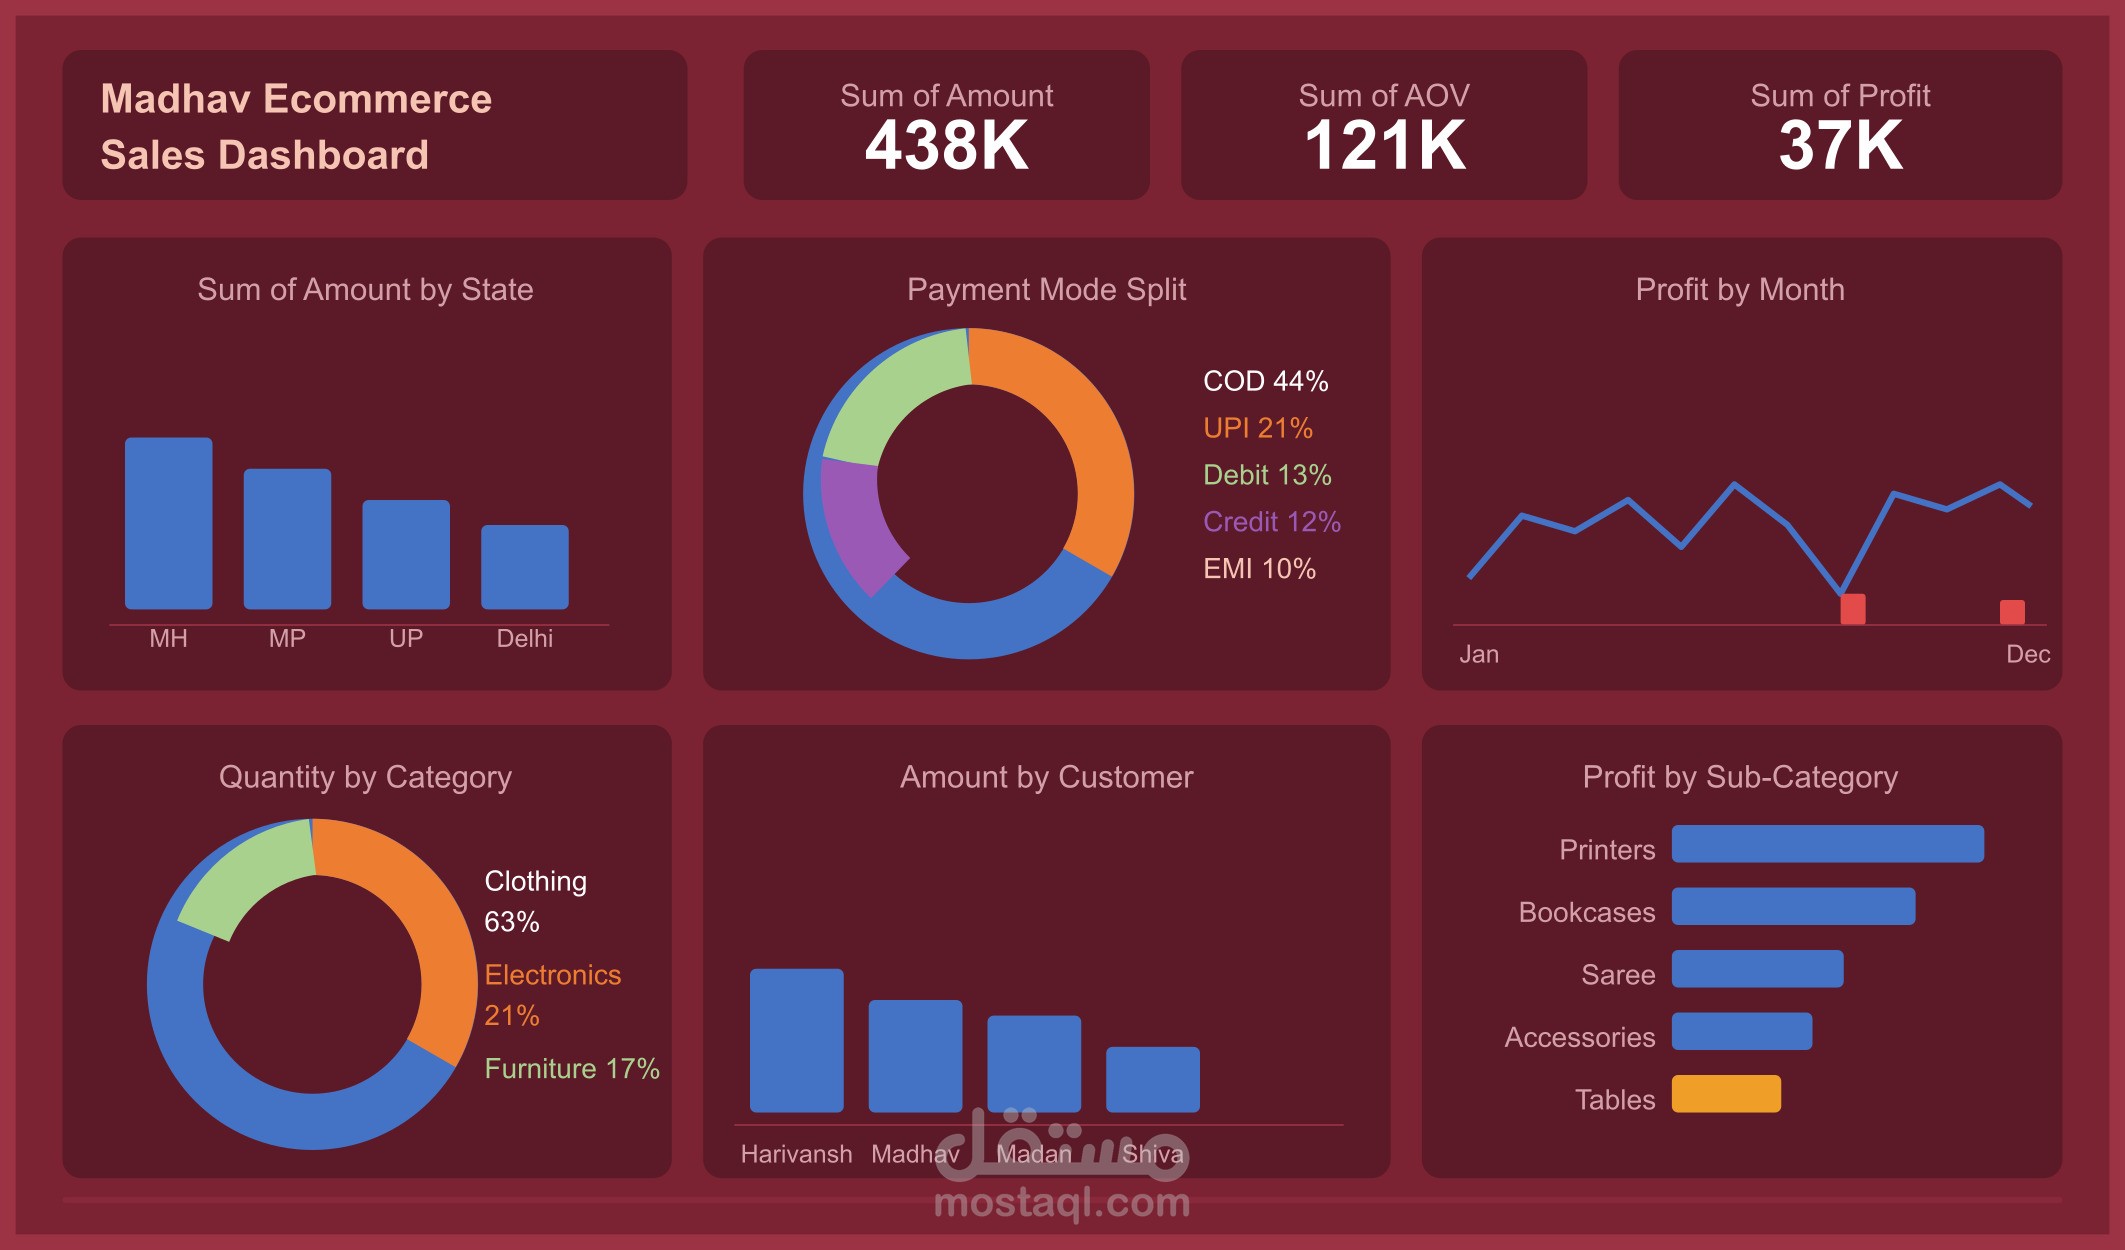
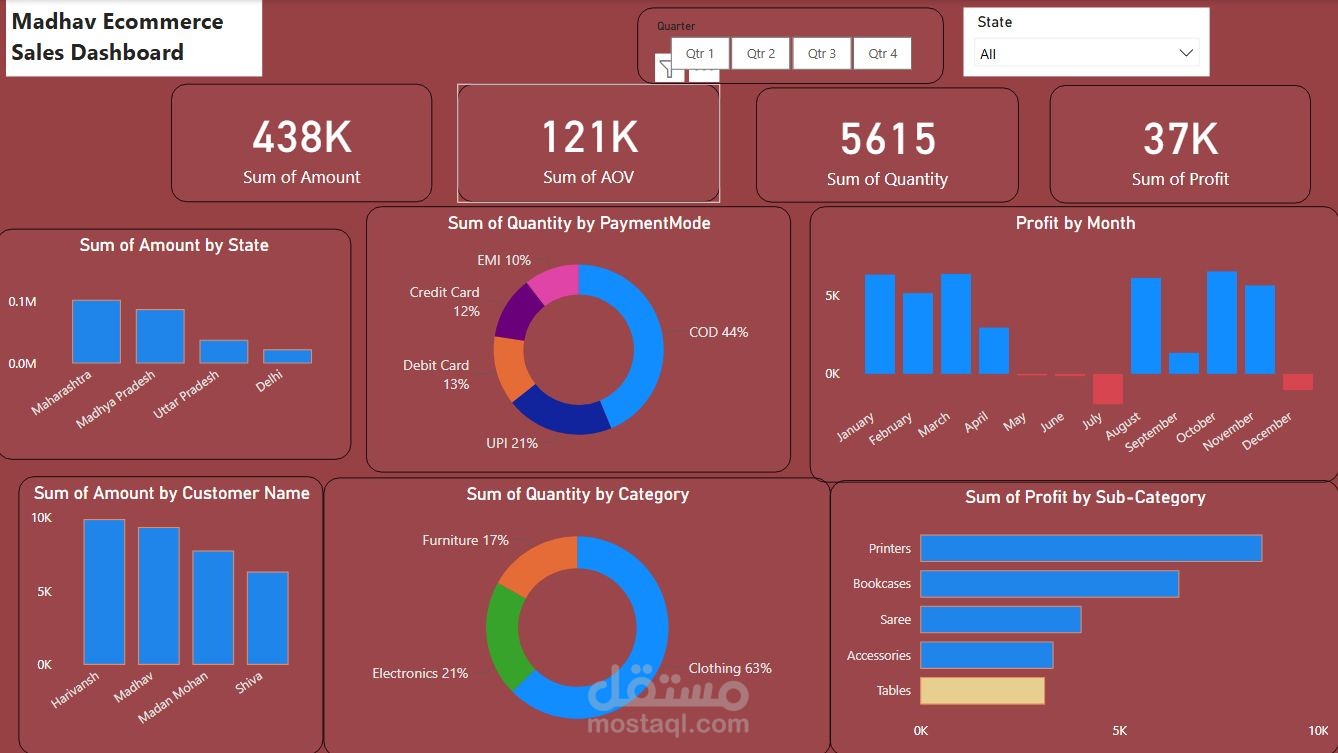
Built a full e-commerce sales dashboard in Power BI analyzing 438K in total sales, 121K average order value, and 37K profit across multiple states and product categories.
The dashboard includes quarterly and state-level filters, payment mode breakdown (COD, UPI, Credit/Debit Card, EMI), profit trends by month, top customers by revenue, category distribution across Clothing, Electronics and Furniture, and sub-category profit analysis by Printers, Bookcases, Saree, Accessories and Tables.
Designed for business owners and sales managers who need a clear picture of what is selling, where, and how profitable.