داشبورد تفاعلي لإدارة وتحليل مخزون الصيدلية باستخدام Power BI
تفاصيل العمل
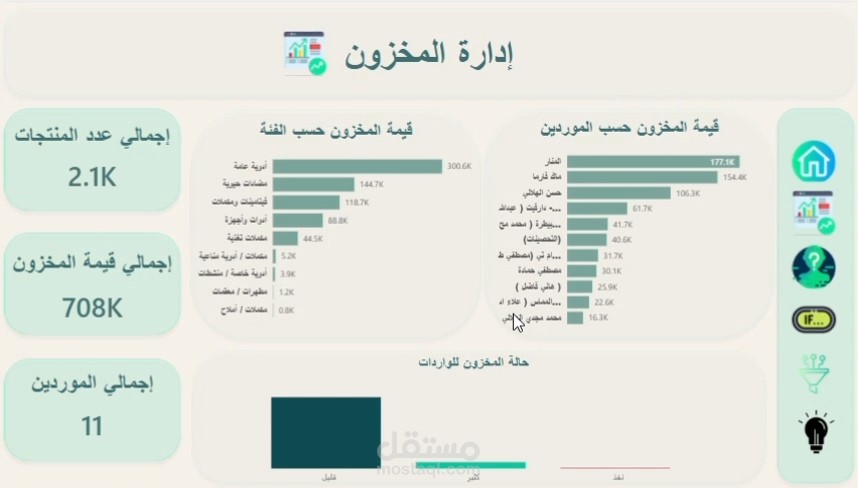

قمت بتصميم وتنفيذ داشبورد تفاعلي الإدارة وتحليل مخزون صيدلية باستخدام Power BI بهدف دعم اتخاذ القرار وتحسين رؤية الأداء.
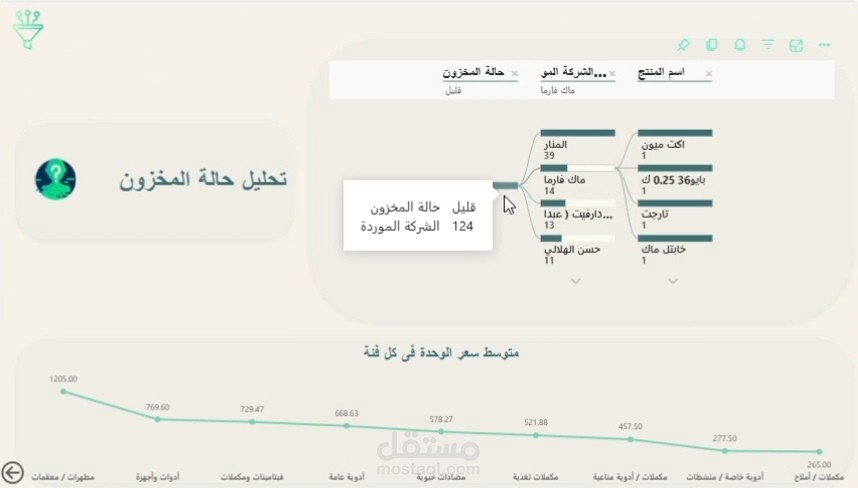
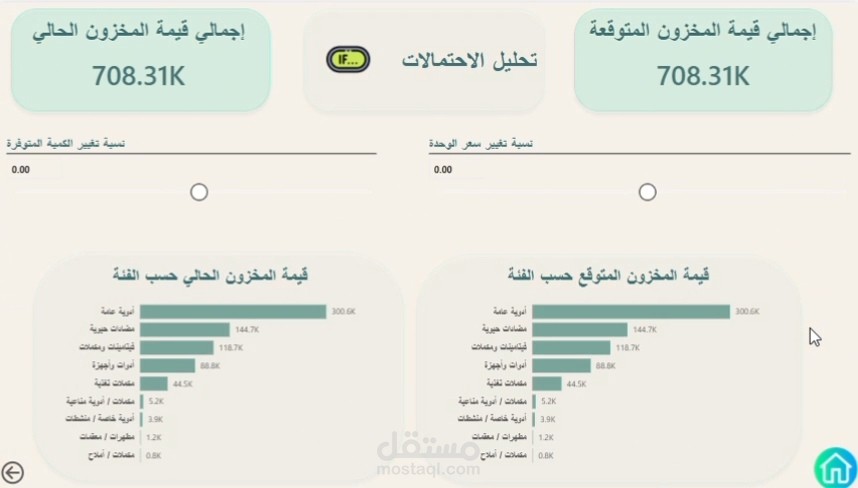
صفحة Overview لعرض المؤشرات الرئيسية وقيمة المخزون الحالية. صفحة تحليل حالة المخزون باستخدام Decomposition Tree التحليل القيم حسب الحالة، المنتج، والمورد. صفحة What If Analysis لمحاكاة السيناريوهات المتوقعة ومقارنة قيمة المخزون الحالية بالقيمة المستقبلية.
أهم المميزات
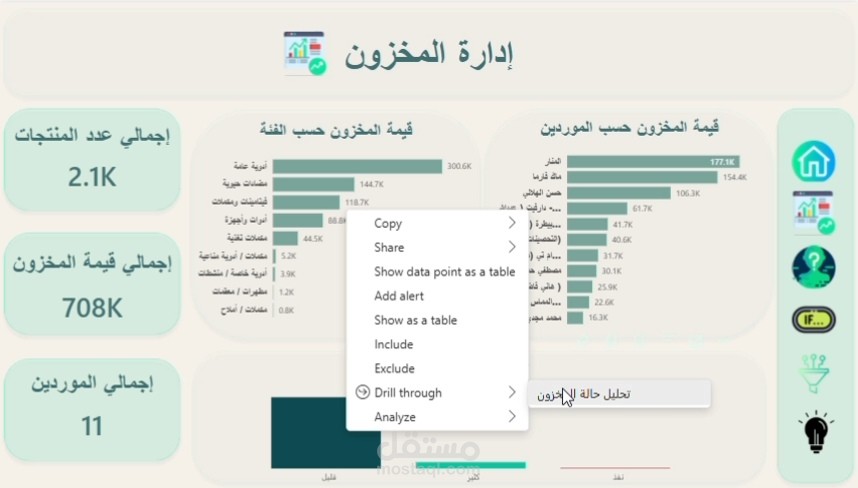
للانتقال بين الصفحات وتحليل البيانات بعمق Drill Through
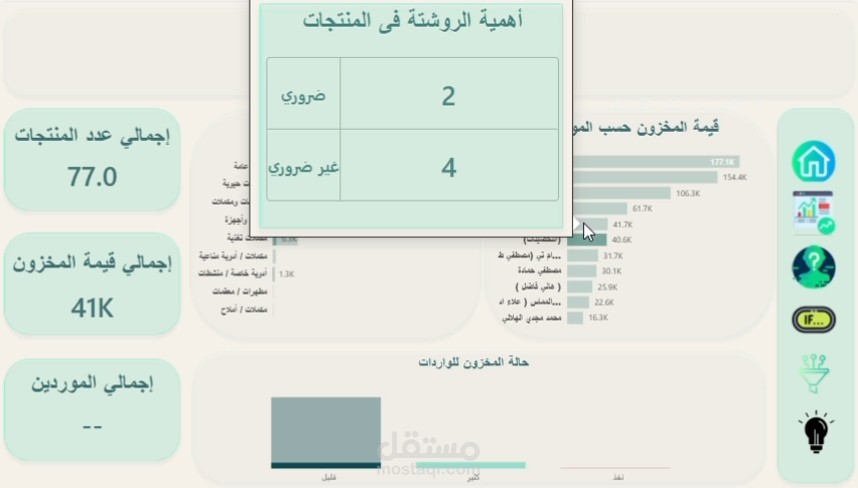
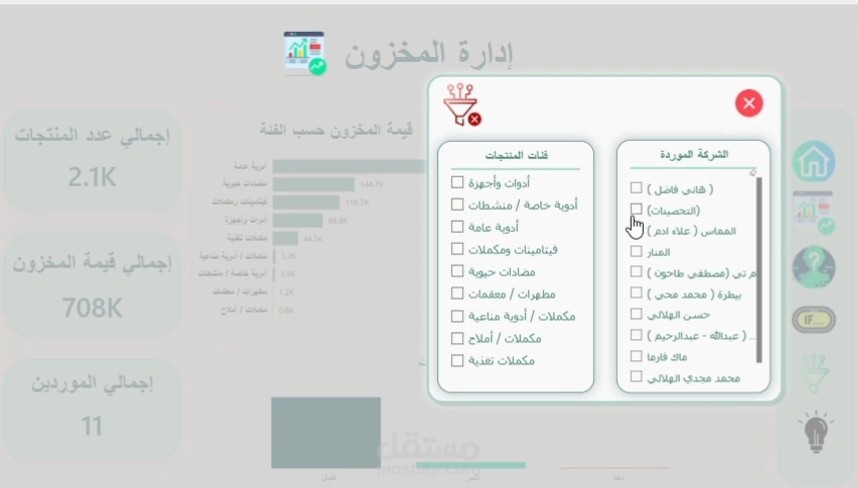
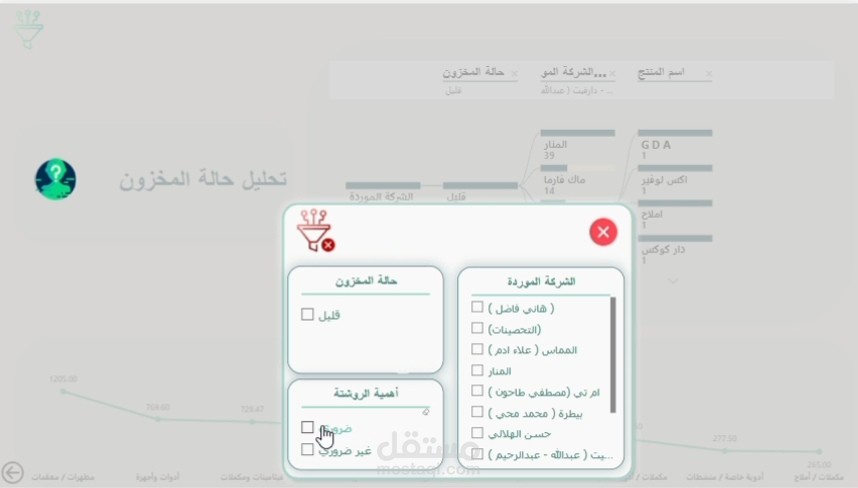
لزيادة التفاعلية وسهولة الاستكشاف Filters & Tooltips
لتحسين تجربة المستخدم Dark / Light Mode
تصميم بسيط ومرن يركز على وضوح البيانات.
الداشبورد يساعد على تحليل المخزون الحالي، فهم توزيع القيم وتقييم تأثير التغيرات المحتملة على قيمة المخزون المستقبلية.
I designed and implemented an interactive dashboard for managing and analyzing pharmacy inventory using Power BI, aimed at supporting decision-making and enhancing performance visibility.
Overview Page:
Displays key metrics and current inventory value.
Inventory Status Analysis Page: Uses a Decomposition Tree to analyze values by status, product, and supplier.
What-If Analysis Page: Simulates expected scenarios and compares current inventory value with future projections.
Key Features:
Drill Through: Navigate between pages and analyze data in depth.
Filters & Tooltips: Increase interactivity and ease of exploration.
Dark/Light Mode: Enhances user experience.
Simple and Flexible Design: Focused on clear data presentation.
The dashboard helps analyze current inventory, understand value distribution, and assess the impact of potential changes on future inventory value.