This dashboard represents a sales dataset analysis
تفاصيل العمل
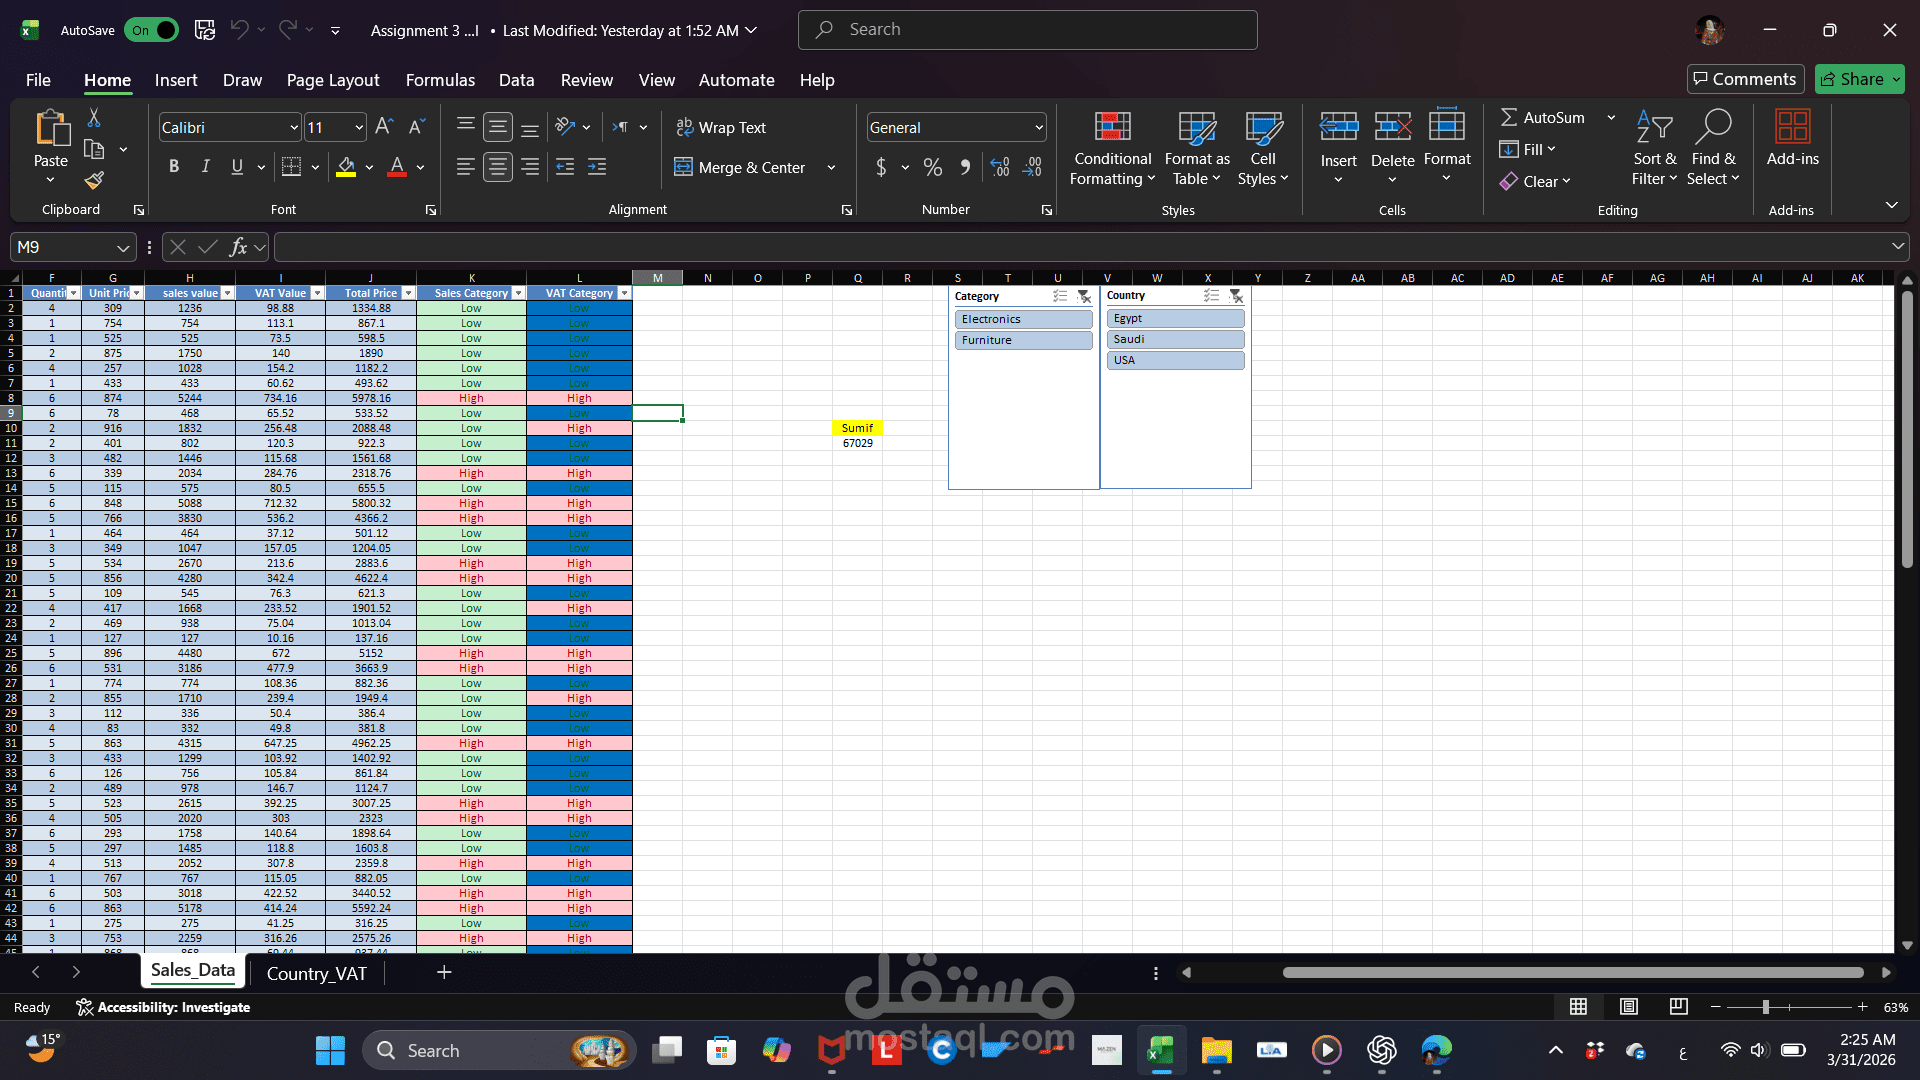
This dashboard represents a sales dataset analysis using Microsoft Excel, focusing on data organization, calculation, and basic insights extraction.
The dataset includes key fields such as Quantity, Unit Price, Sales Value, VAT Value, and Total Price. Additional calculated columns like Sales Category and VAT Category are used to classify data into segments such as "High" and "Low" for better analysis.
A summary metric (SUMIF) is applied to calculate total values based on specific conditions, demonstrating the use of conditional aggregation functions.
Interactive slicers for category (e.g., electronics, furniture) and country (e.g., Egypt, Saudi, USA) allow users to filter the data dynamically and explore results based on different dimensions.
Overall, this project highlights skills in data cleaning, data transformation, conditional logic, and Excel functions to generate meaningful insights from raw data.