القاهرة الجديدة - مصر
تفاصيل العمل
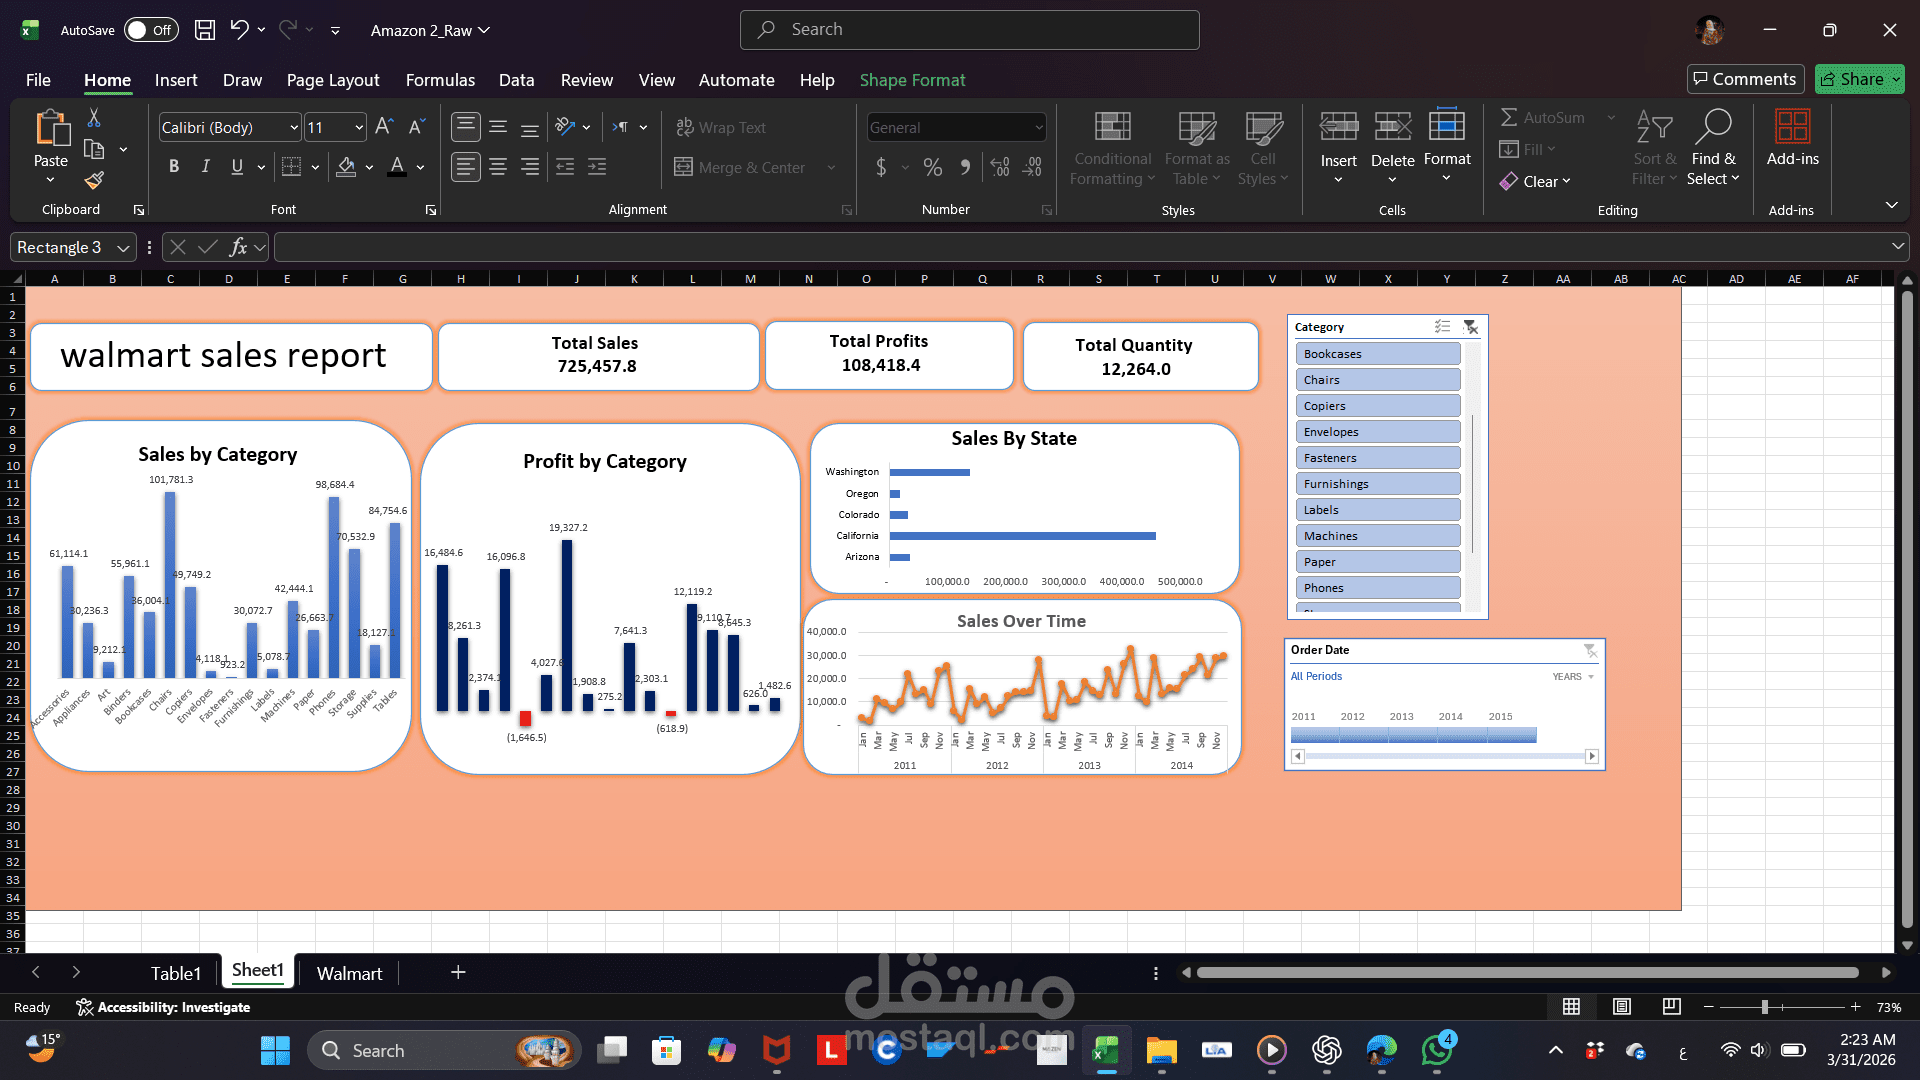
This dashboard represents a Sales Analysis for Walmart, providing a comprehensive overview of business performance.
It includes key performance indicators such as Total Sales, Total Profit, and Total Quantity to give a quick summary of overall performance. The dashboard also analyzes sales and profit by category, helping identify the most profitable and least profitable product segments.
Additionally, it shows sales distribution across different states to highlight top-performing locations, as well as sales trends over time to track growth and seasonal patterns.
Interactive filters (slicers) such as Category and Order Date allow users to dynamically explore the data and gain deeper insights.
Overall, this dashboard helps in making data-driven decisions by identifying trends, opportunities, and areas for improvement.