Sales Analytics Dashboard (Power BI)
تفاصيل العمل
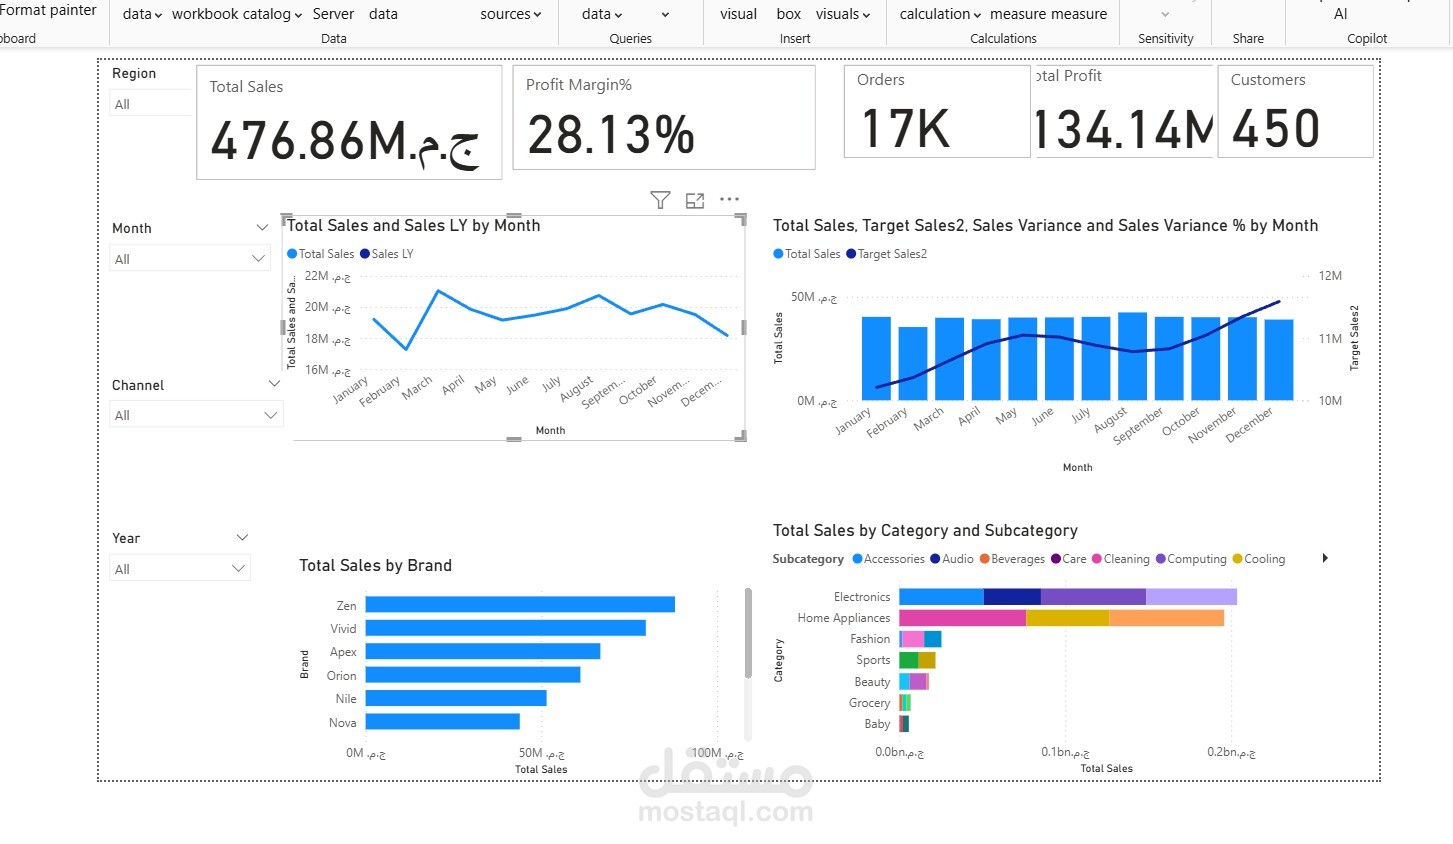
Developed an interactive dashboard using Power BI to monitor and analyze business performance. The dashboard highlights key metrics such as total sales, profit margin, total profit, orders, and customer count. It includes advanced visualizations like monthly sales trends with year-over-year comparison, target vs actual performance with variance analysis, and sales breakdown by brand, category, and subcategory.
Dynamic filters (Region, Month, Channel, Year) allow users to explore data from multiple perspectives, enabling better insights and data-driven decision-making.