salles dashbord excel
تفاصيل العمل
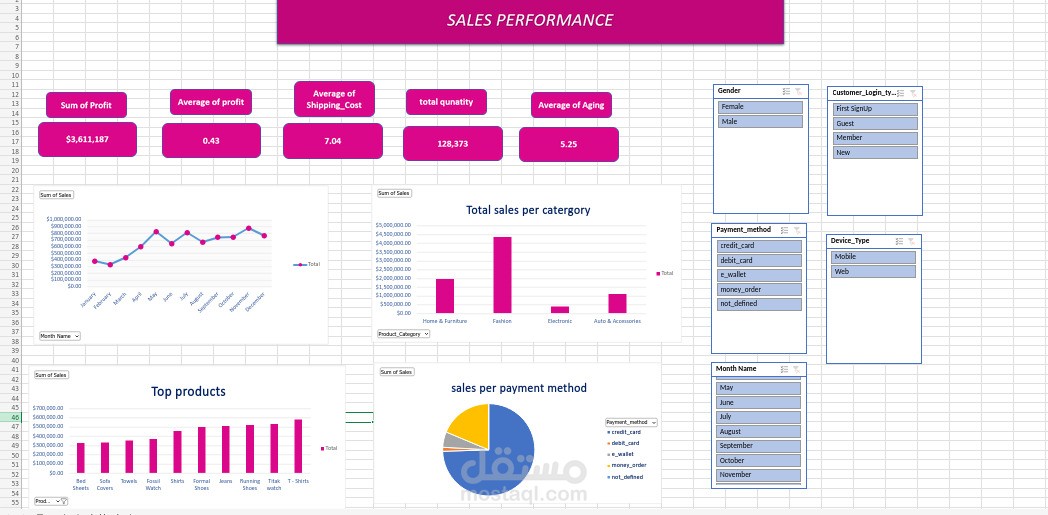
Interactive dashboard built using Excel to analyze business performance. It tracks key KPIs such as total profit, average profit, shipping cost, and total quantity. Includes visualizations like sales trends over time, top-performing products, category-wise sales, and payment method distribution. Users can filter data dynamically by gender, device type, payment method, and month to gain deeper insights and support decision-making.