Stock market history
تفاصيل العمل
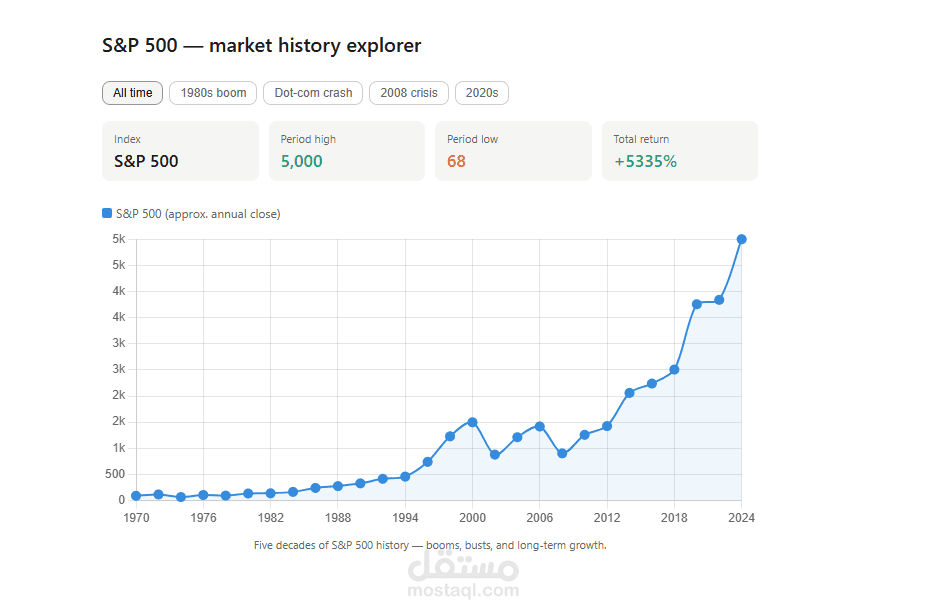
The stock market history explorer is an interactive visualization of the S&P 500 from 1970 to 2024. It has five era filters to zoom into key periods:
All time — the full 50-year view
1980s boom — Reagan-era bull run
Dot-com crash — the 2000 bubble and collapse
2008 crisis — the financial meltdown and recovery
2020s — COVID, rate hikes, and the AI surge