Advanced Sales Dashboard With Excel
تفاصيل العمل

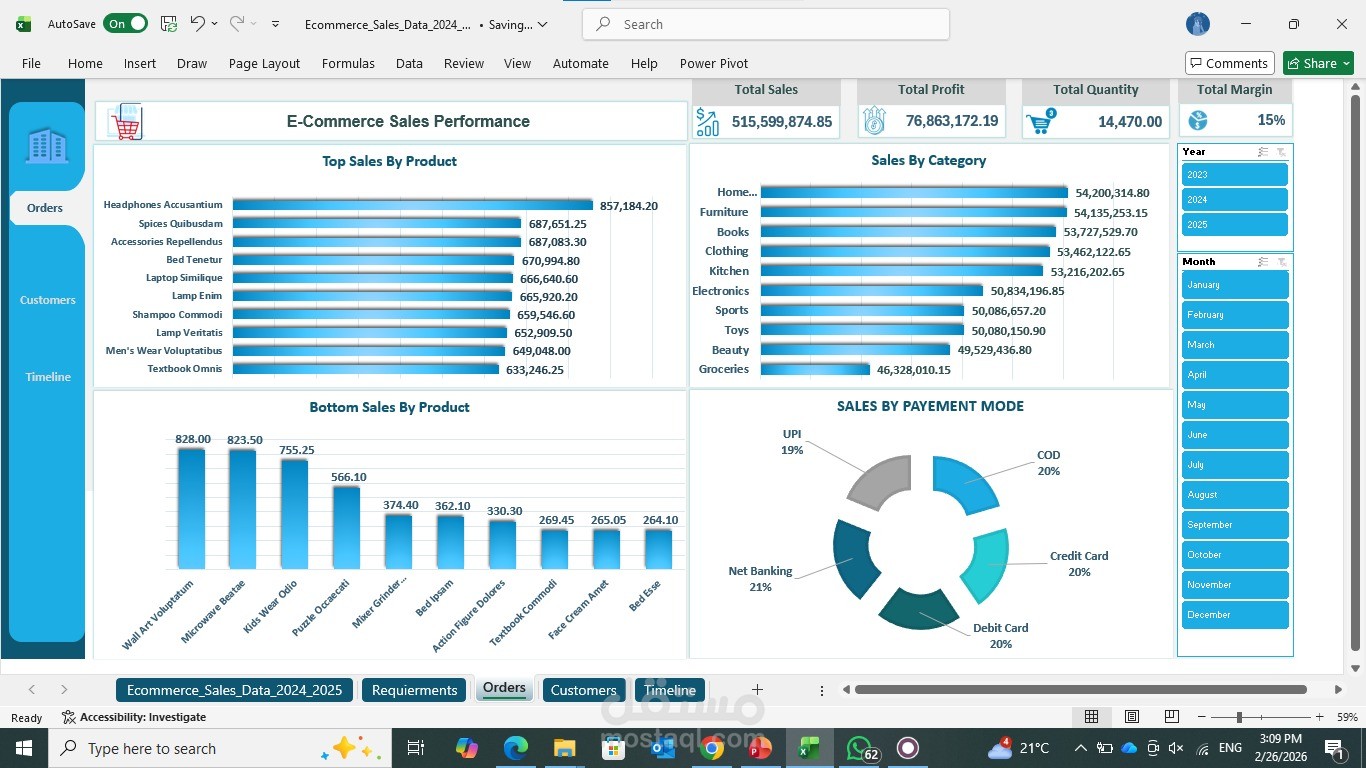
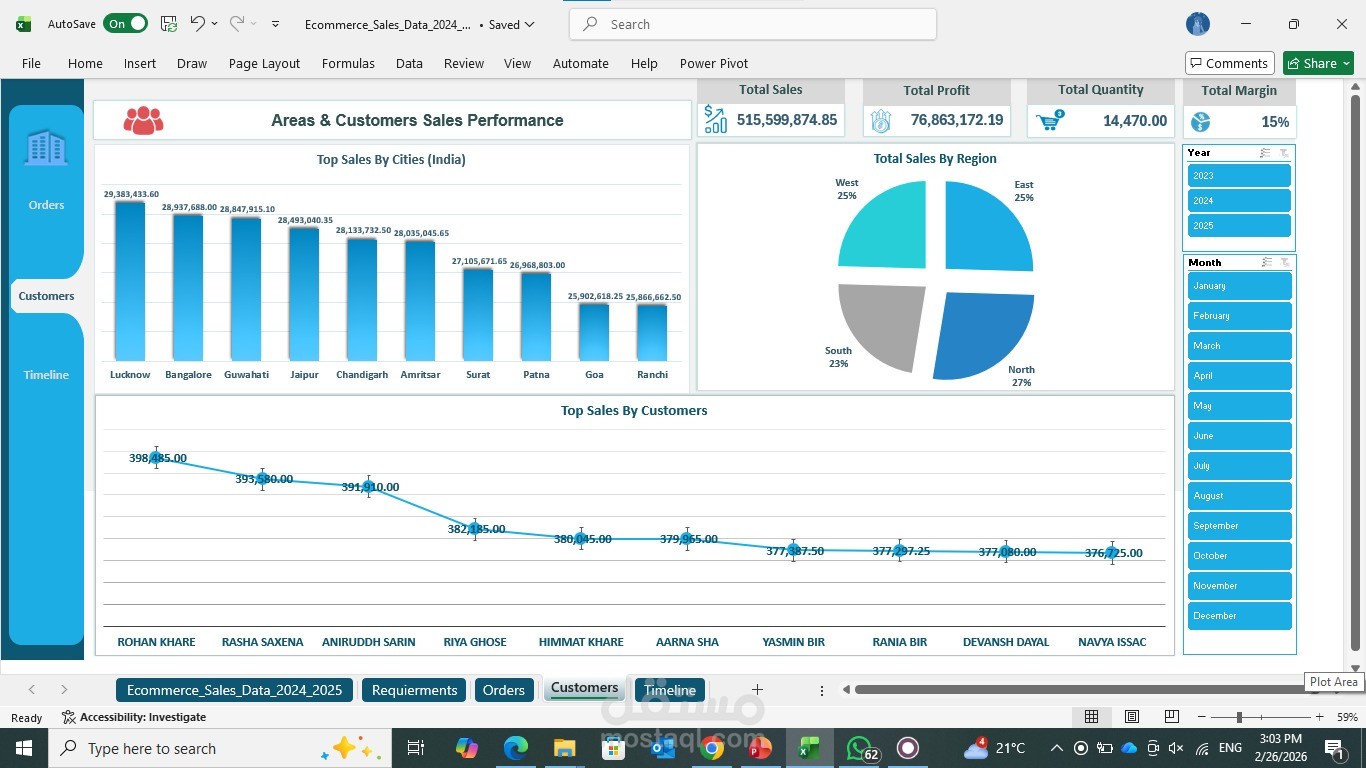
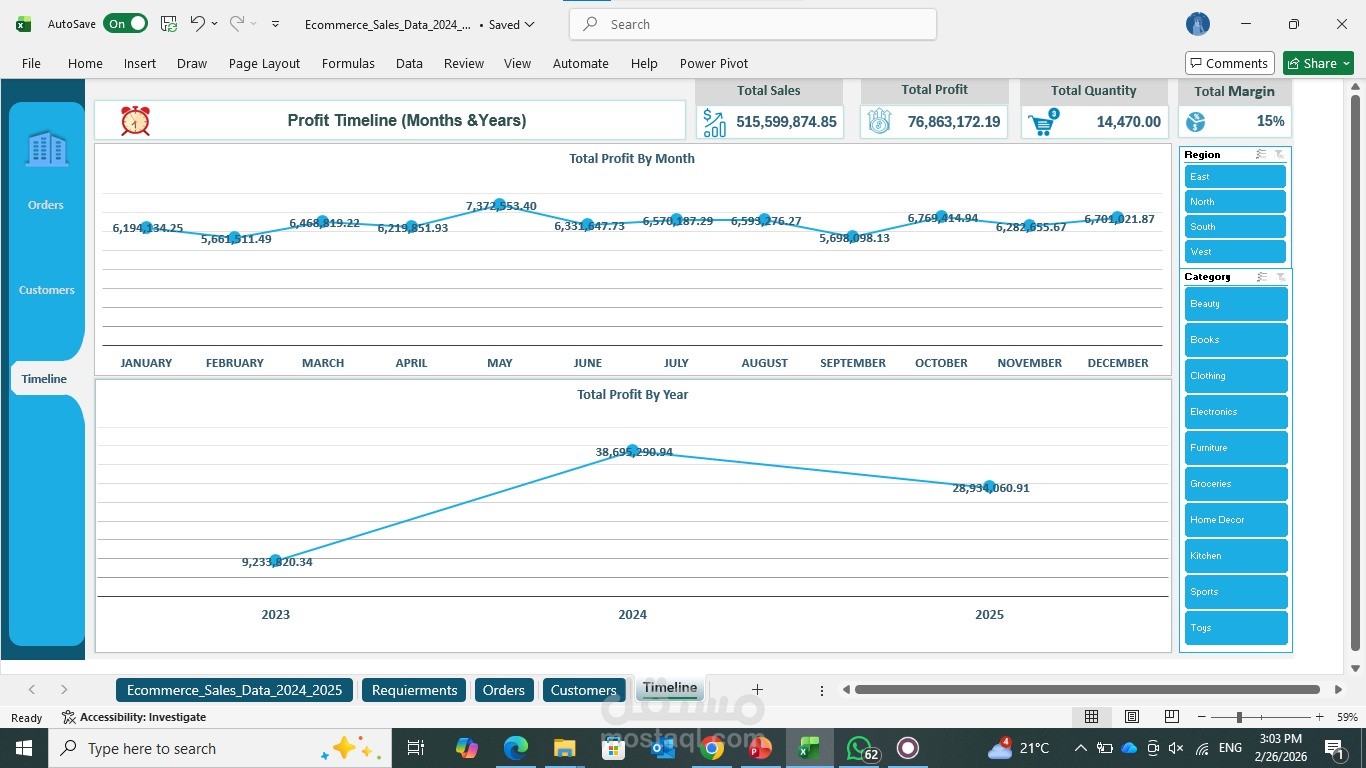
This Excel dashboard transforms raw data into clear business insights, analyzing sales performance from multiple angles.
It highlights key metrics like total sales, profit, and quantity, along with top and bottom products.
The dashboard also shows sales by category, payment methods, regions, cities, and customers.
Built using Power Pivot and Pivot Charts, it tracks profit trends over time to support better understanding of business and making better decisions.