NYC Transit Dynamics: MTA Ridership & Pandemic Impact Analysis
تفاصيل العمل
Project Overview:
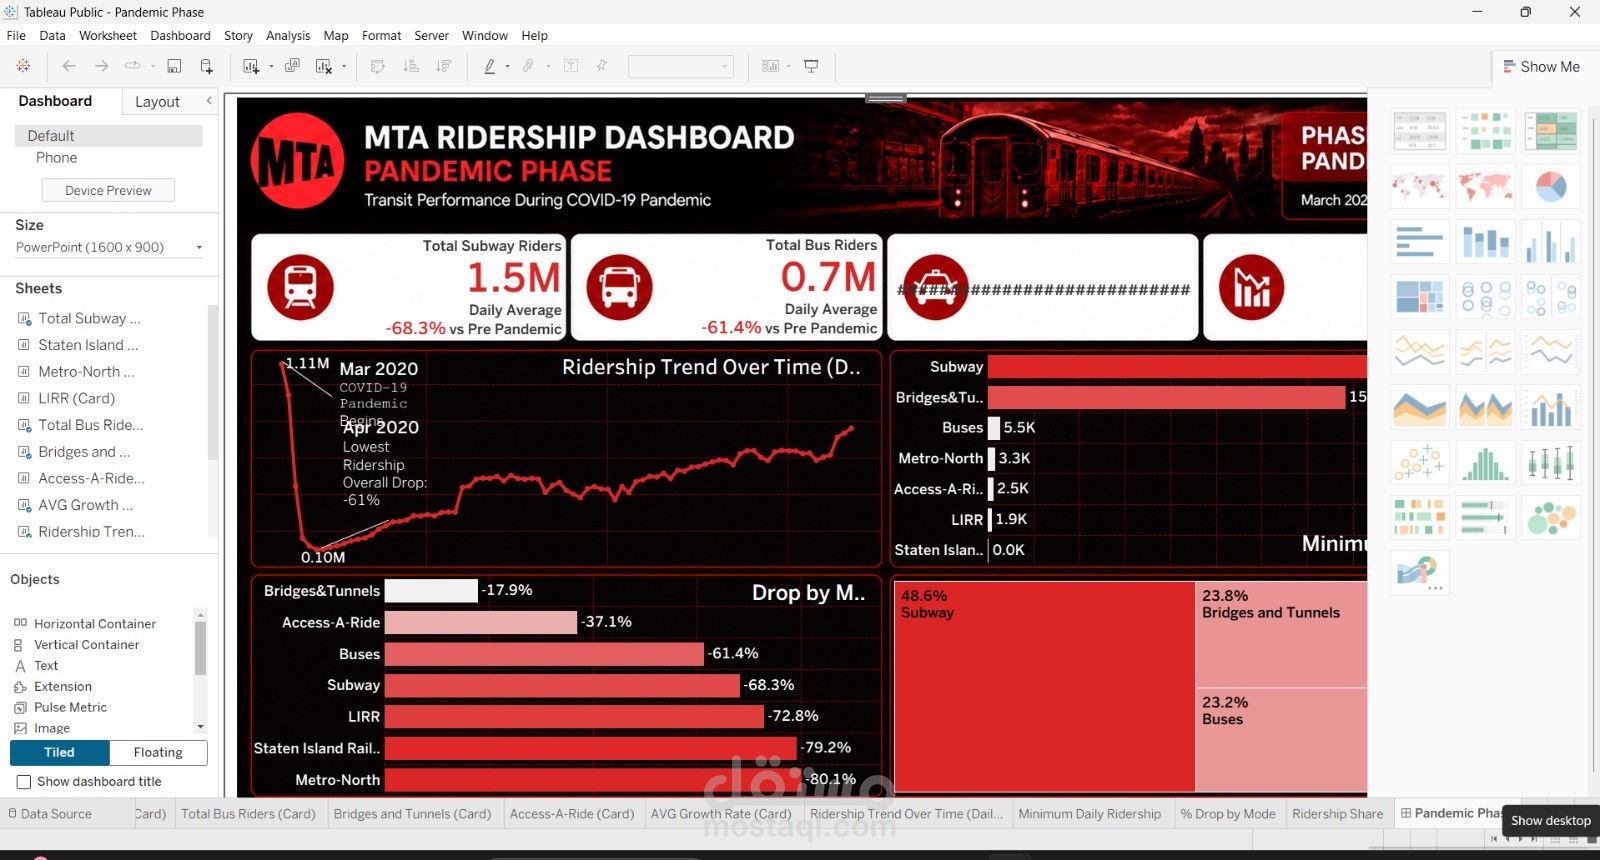
This project features an interactive data dashboard built to analyze and visualize the impact of the COVID-19 pandemic on New York City’s transportation network. Utilizing the "cleaned_mta_data مستقل.csv" dataset, the analysis tracks ridership trends across subways, buses, LIRR, and Metro-North from the initial pandemic drop in March 2020 through the recovery phases.
The dashboard provides critical insights into daily averages, percentage drops compared to pre-pandemic levels, and a comparative performance analysis of different transit modes. It highlights key milestones, such as the 61% overall ridership drop in April 2020, offering a comprehensive view of urban mobility resilience and shifting commuting patterns in NYC