Sales Dashboard Visualization Using Python
تفاصيل العمل
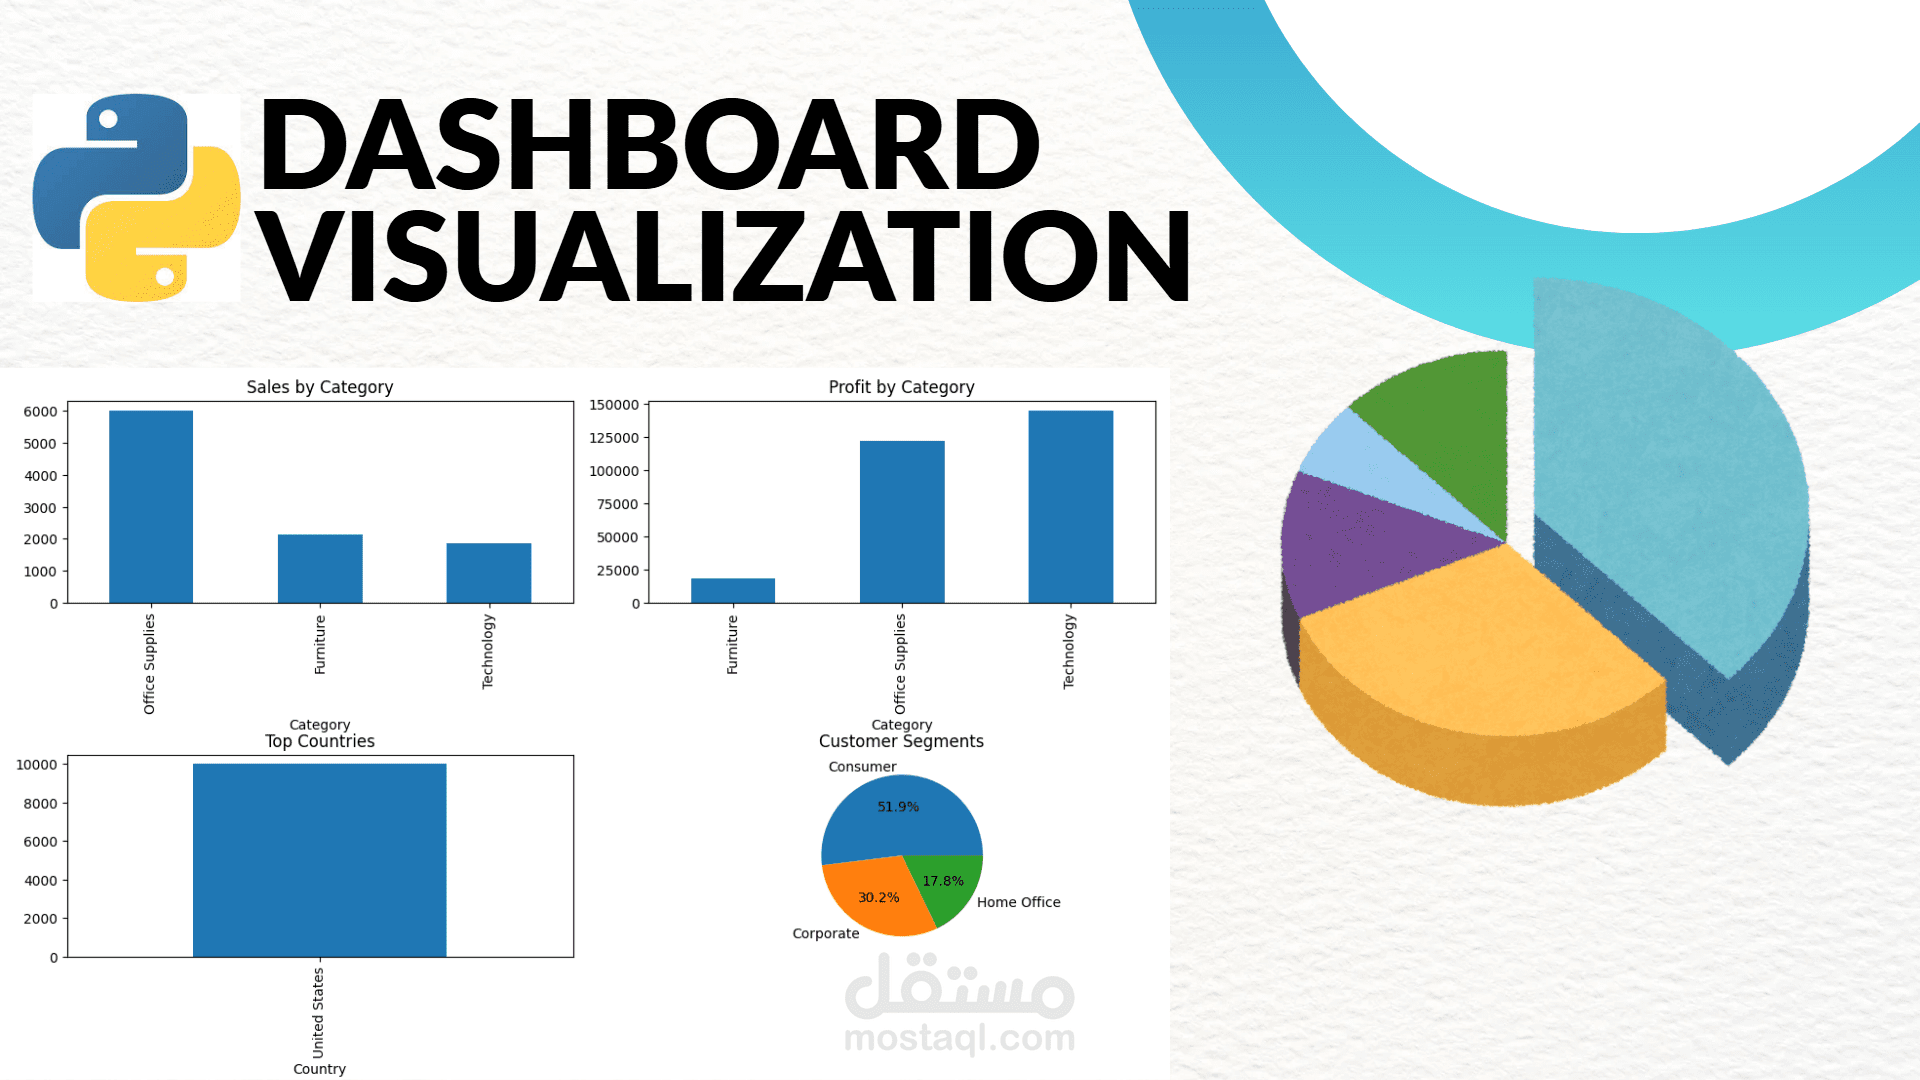
This project presents a data visualization dashboard built using Python to display and analyze sales data in a structured and easy-to-understand way.
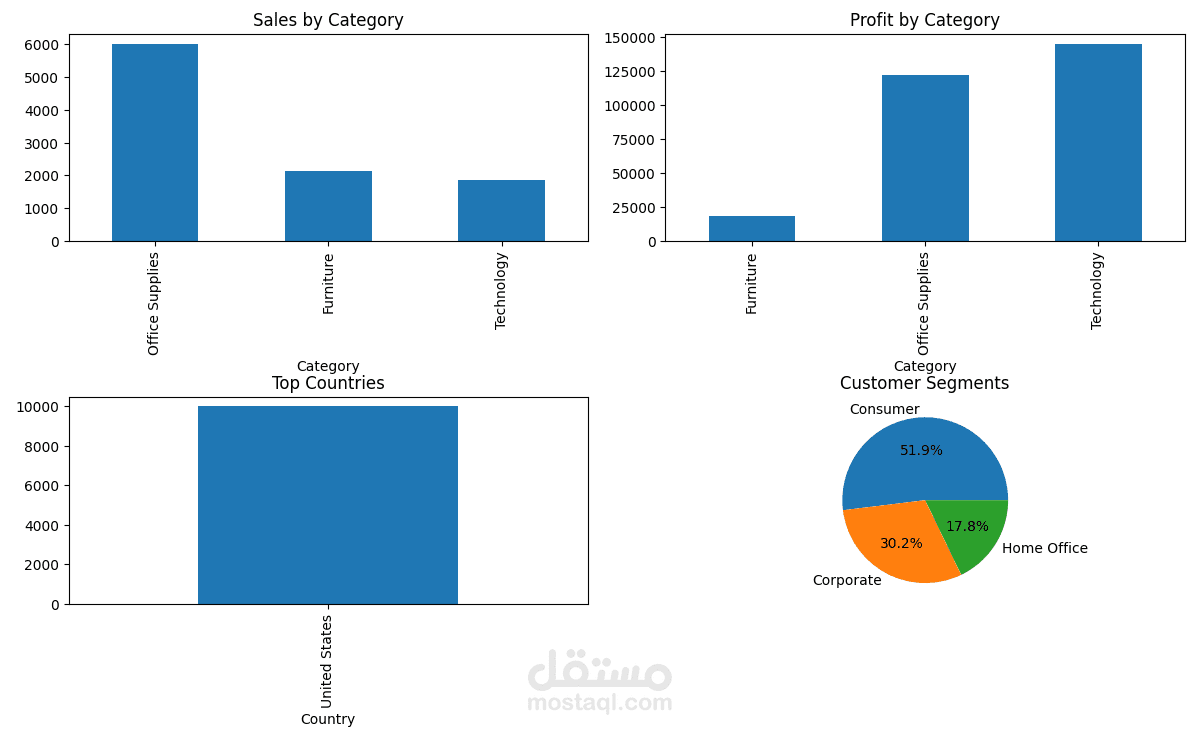
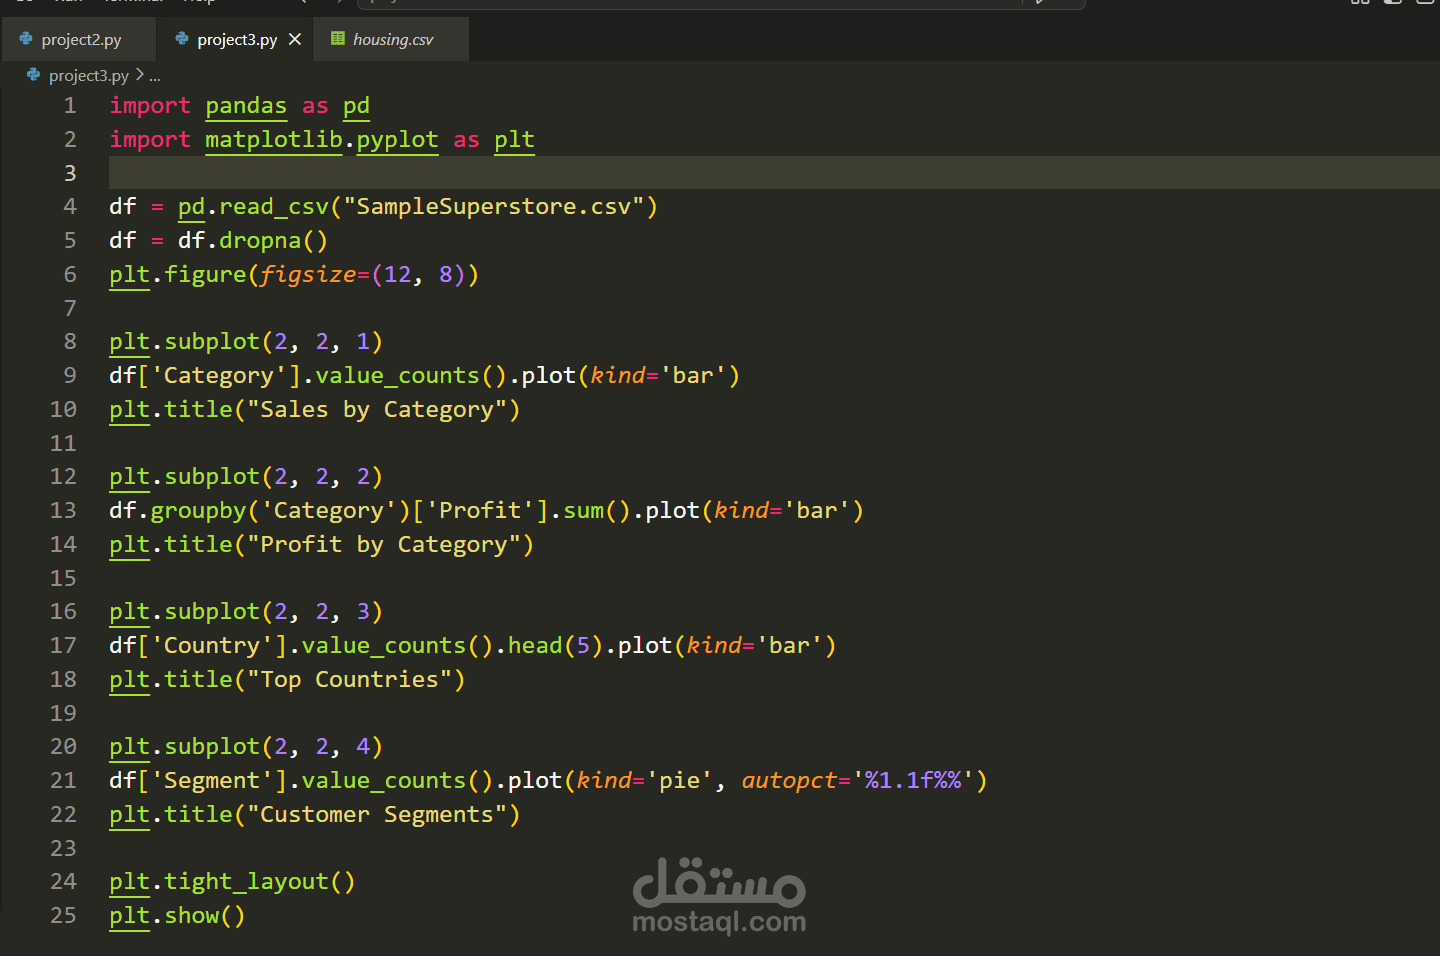
The Matplotlib library was used to create several charts illustrating sales distribution, profits by category, and key countries, in addition to analyzing customer segments.
The project aims to transform data into a visual dashboard that helps in understanding patterns and making data-driven decisions.