Data Analysis and Visualization using Python (Pandas & Seaborn)
تفاصيل العمل
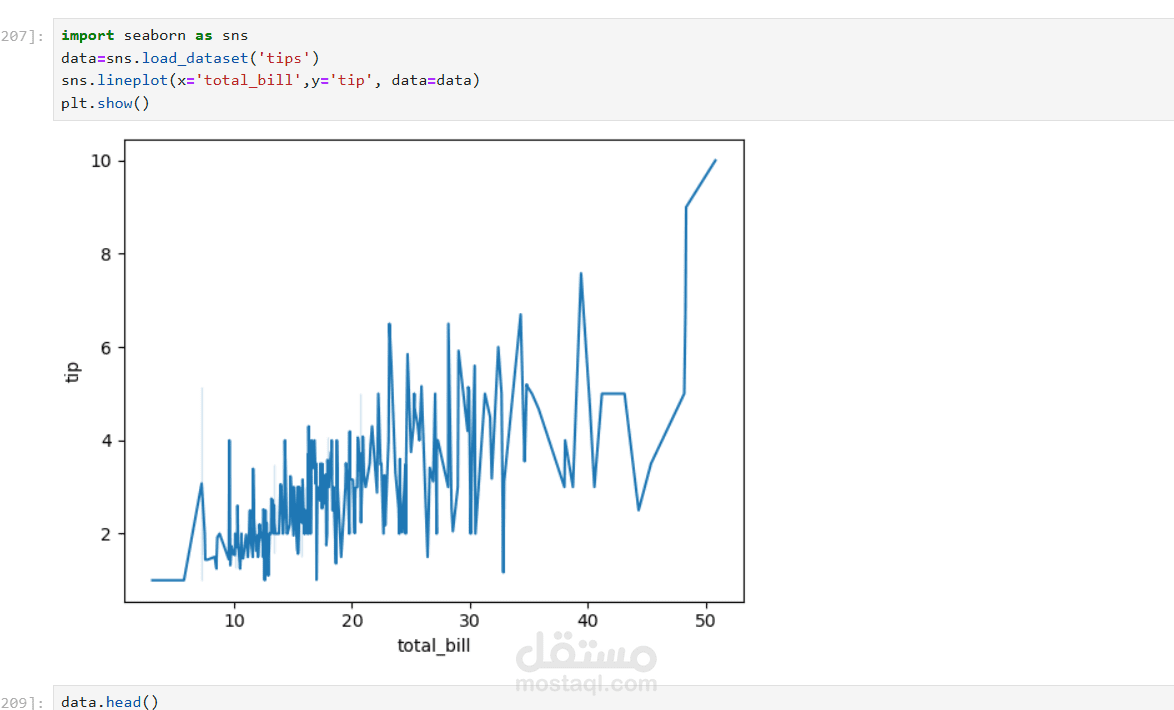
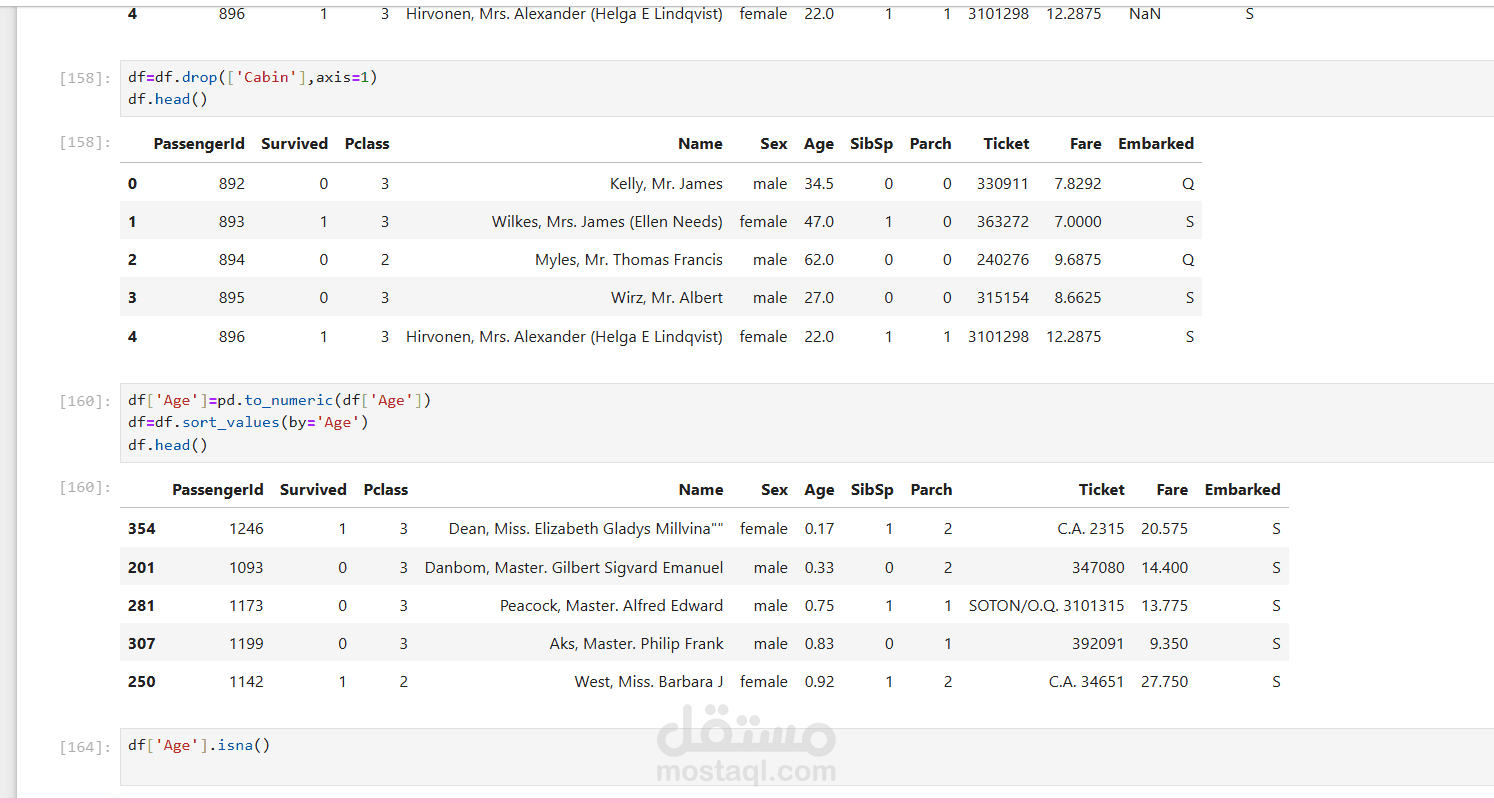
This project showcases basic data analysis and visualization skills using Python libraries such as Pandas and Seaborn. The work includes loading and exploring datasets, performing data cleaning operations (such as dropping unnecessary columns and handling missing values), converting data types, and sorting data for better analysis. Additionally, a line plot is generated to visualize the relationship between total bill and tip values, demonstrating the ability to extract insights from data through visualization.
This project reflects my ability to preprocess real-world datasets, perform exploratory data analysis (EDA), and create meaningful visualizations to support data-driven decision making.