تحليل بيانات
تفاصيل العمل
Supermarket Data Analysis Project
This project focused on analyzing supermarket sales and operations data using Excel, Power Query, and Power BI to deliver actionable insights and a visually consistent dashboard.
• Data Preparation (Excel & Power Query):
Raw transactional data was imported and cleaned using Power Query. Key steps included removing duplicates, handling missing values, standardizing product categories, and creating calculated fields such as revenue, profit margin, and average basket size. Power Query was also used to merge multiple datasets (sales, inventory, and customer information) into a unified data model.
• Data Analysis (Excel):
Pivot Tables and advanced formulas were applied to explore sales trends, identify top-performing products, and evaluate customer purchasing behavior. Conditional formatting highlighted anomalies such as stock shortages or unusually high discounts.
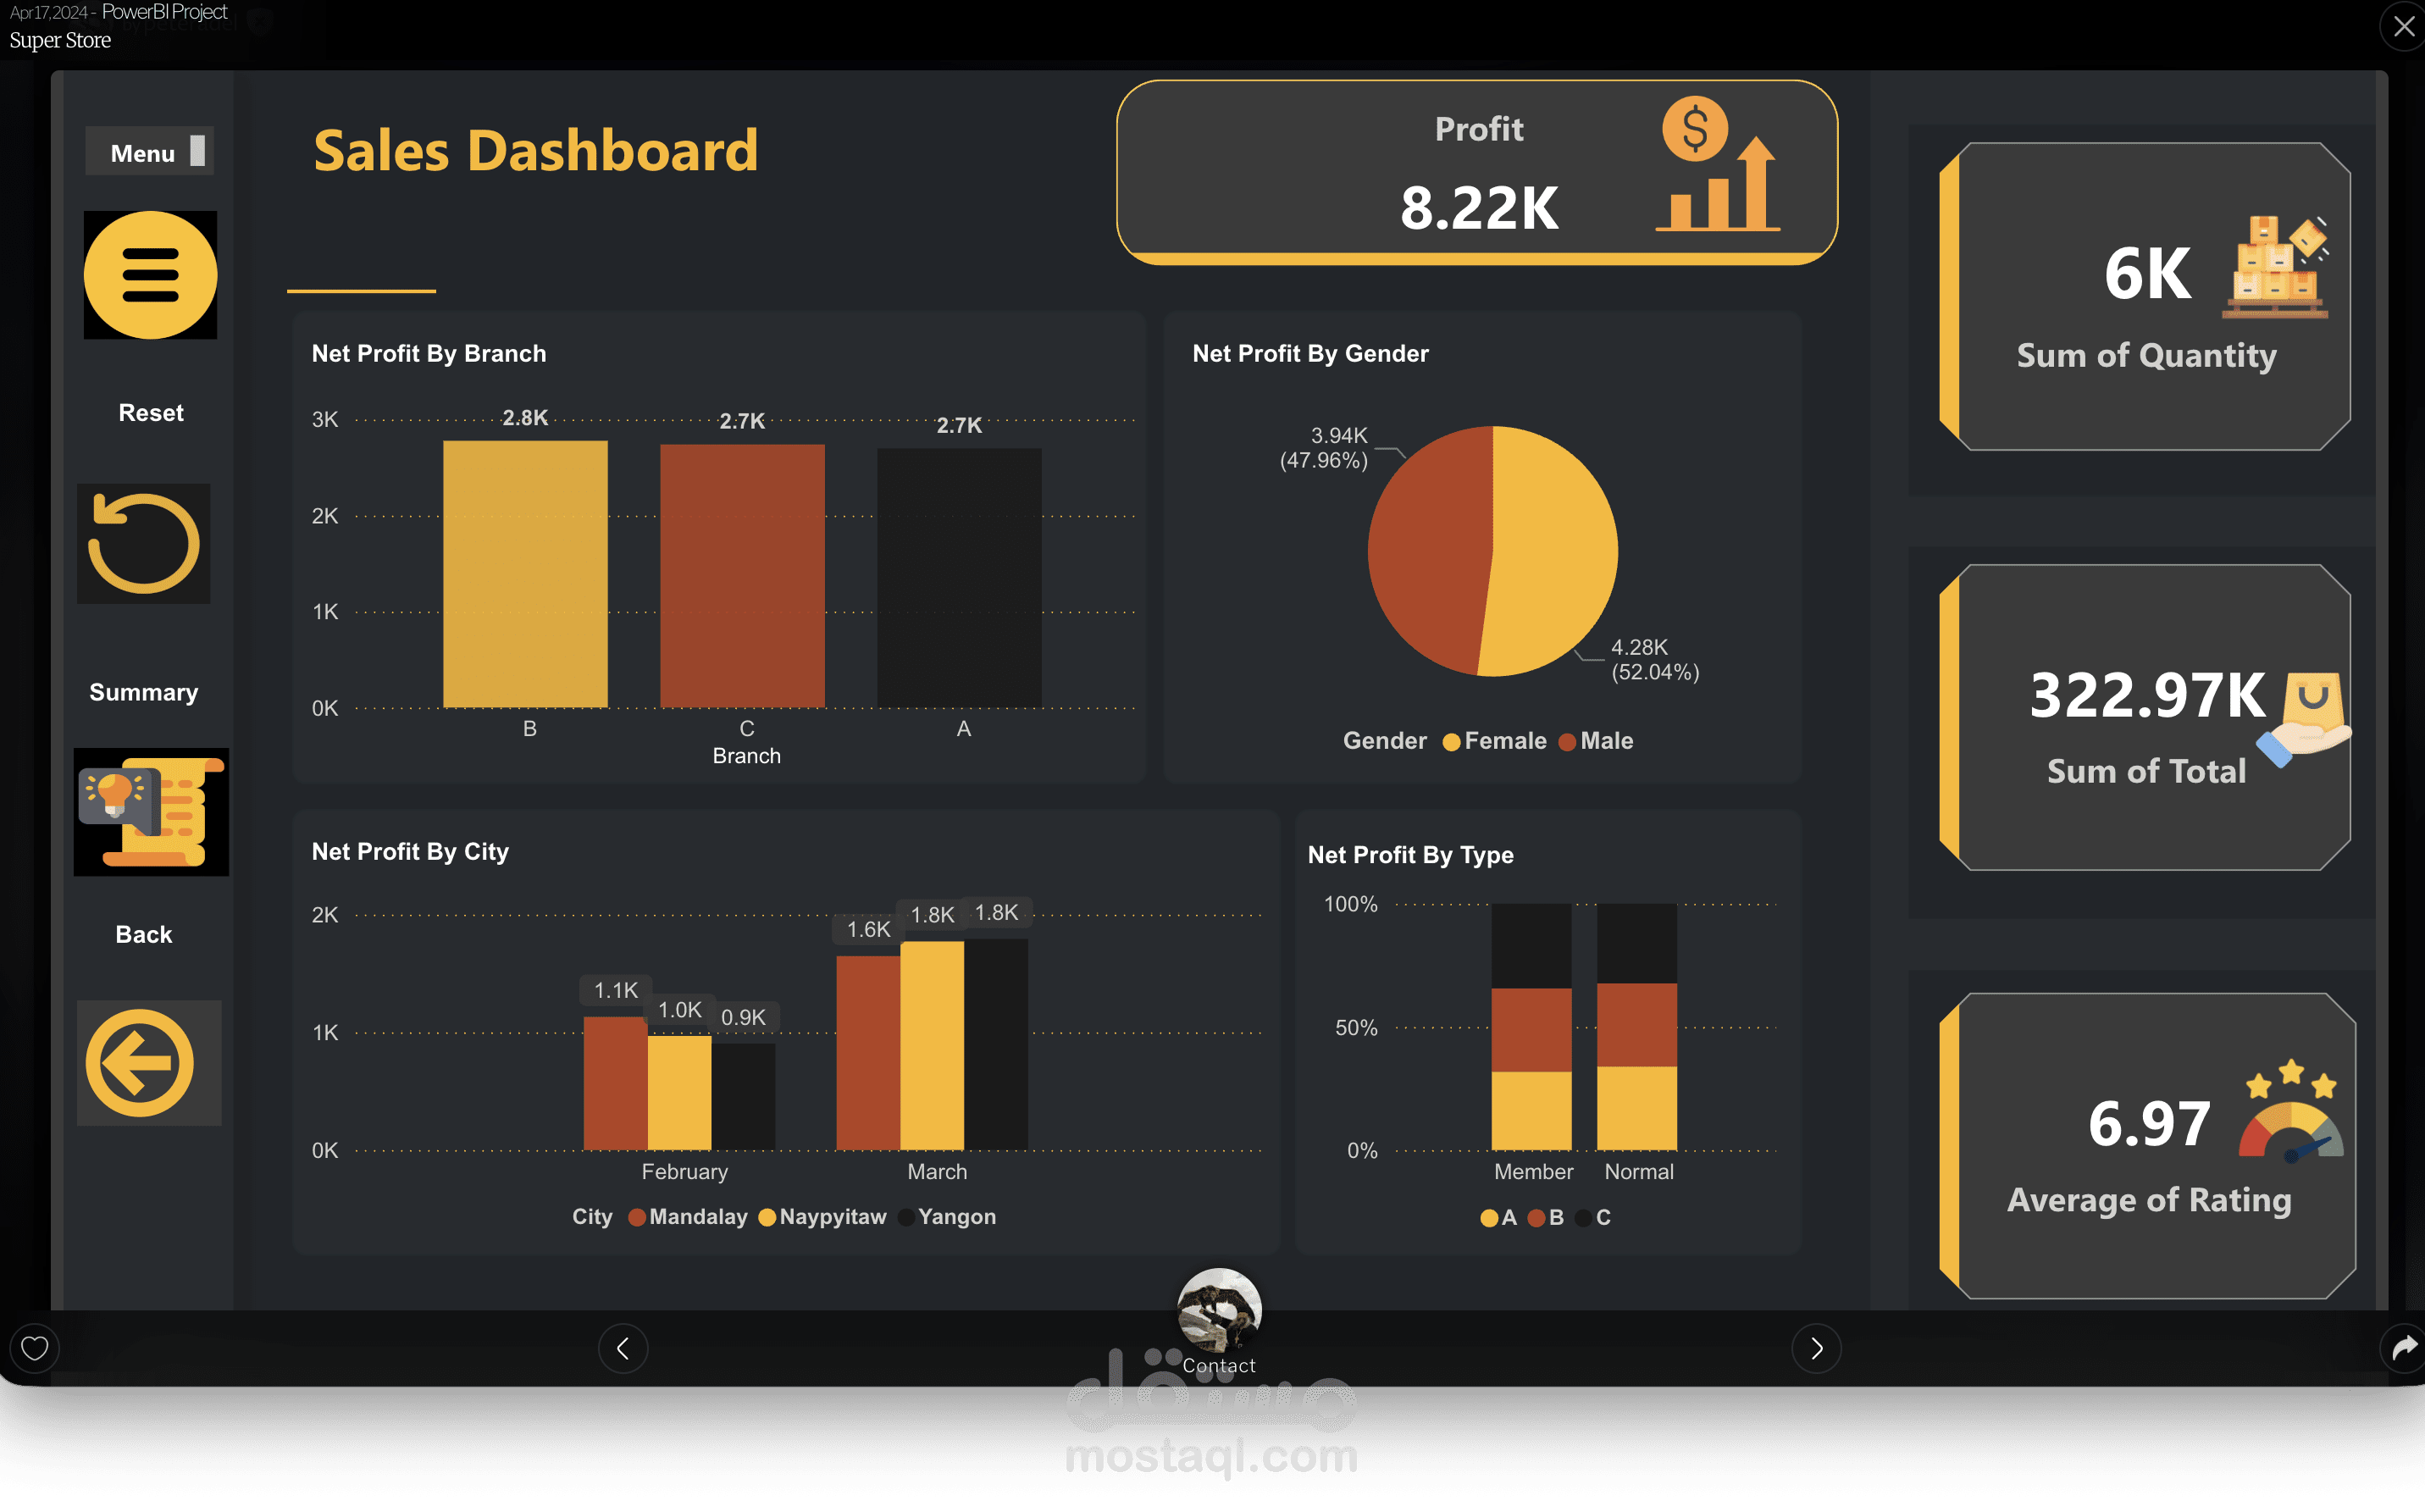
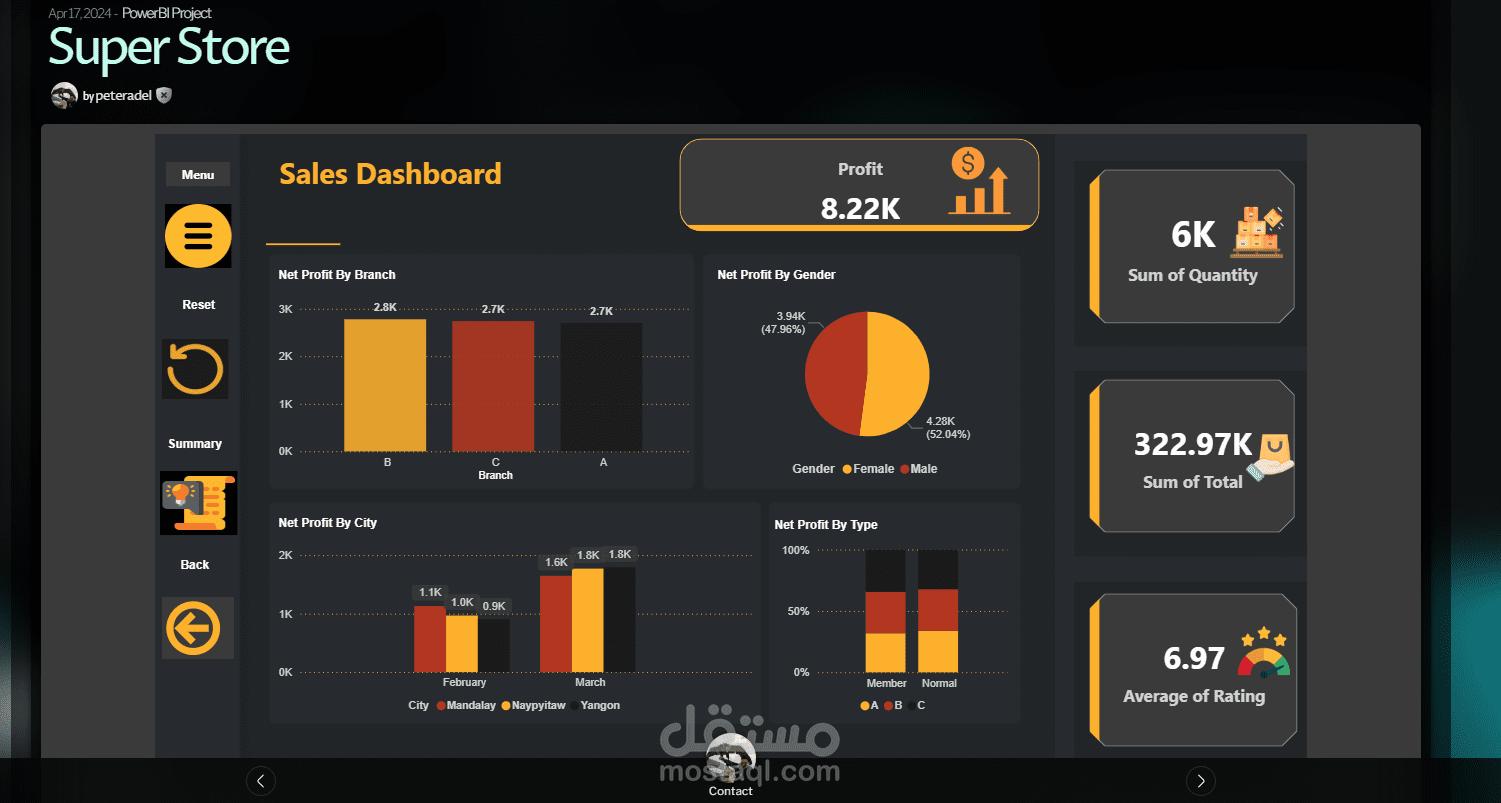
• Visualization & Dashboard (Power BI):
A dynamic dashboard was designed in Power BI to present insights in a clear and interactive format. The dashboard included:• Sales Overview: Total revenue, profit, and growth trends over time.
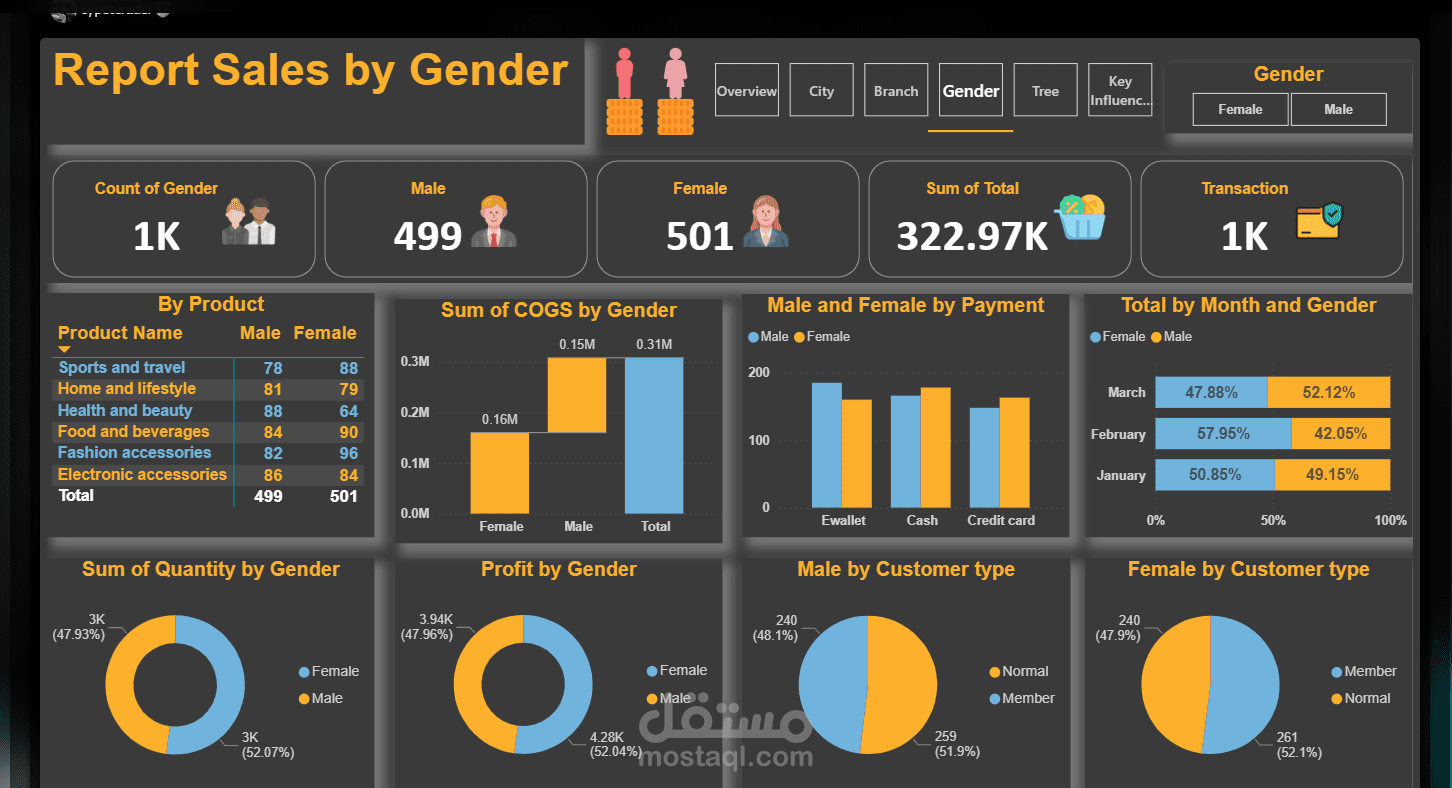
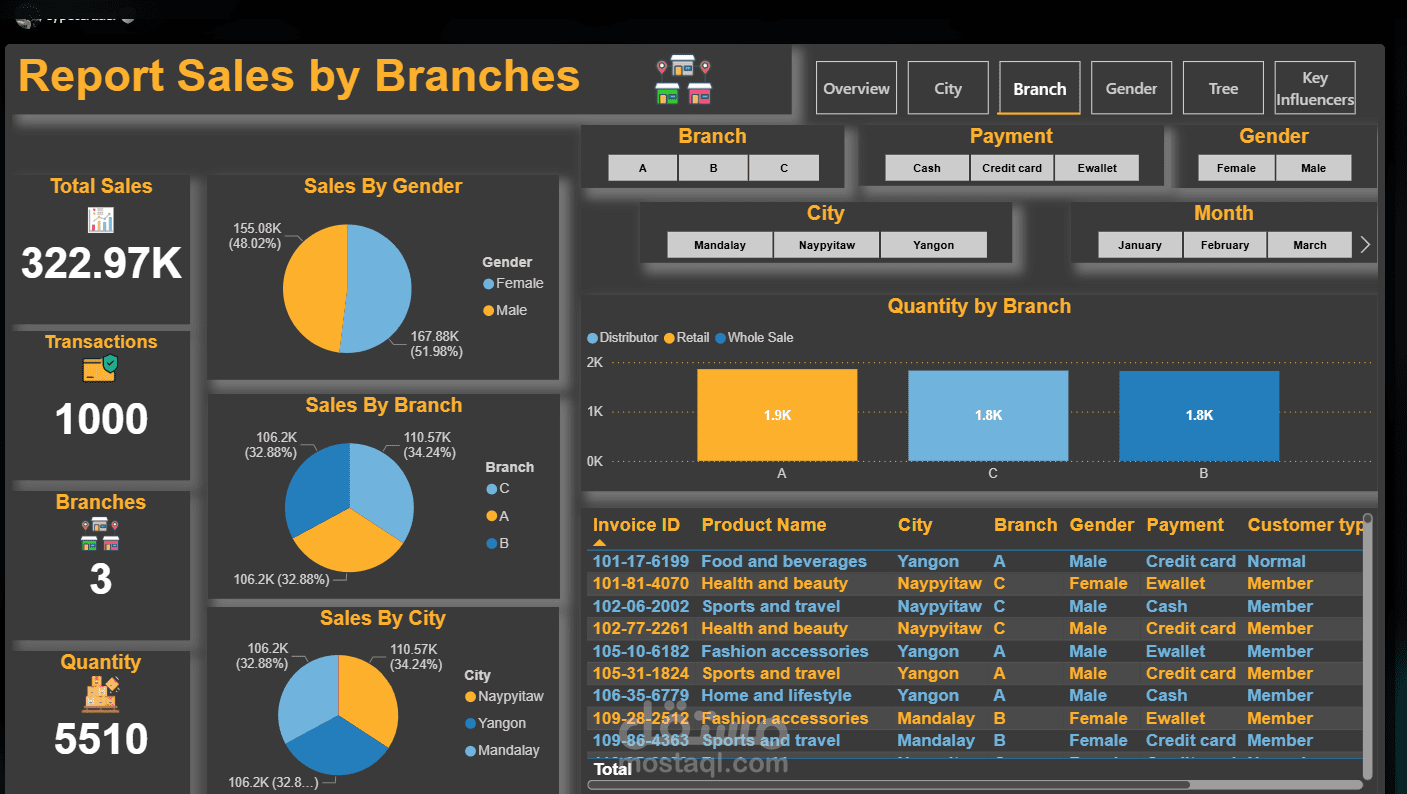
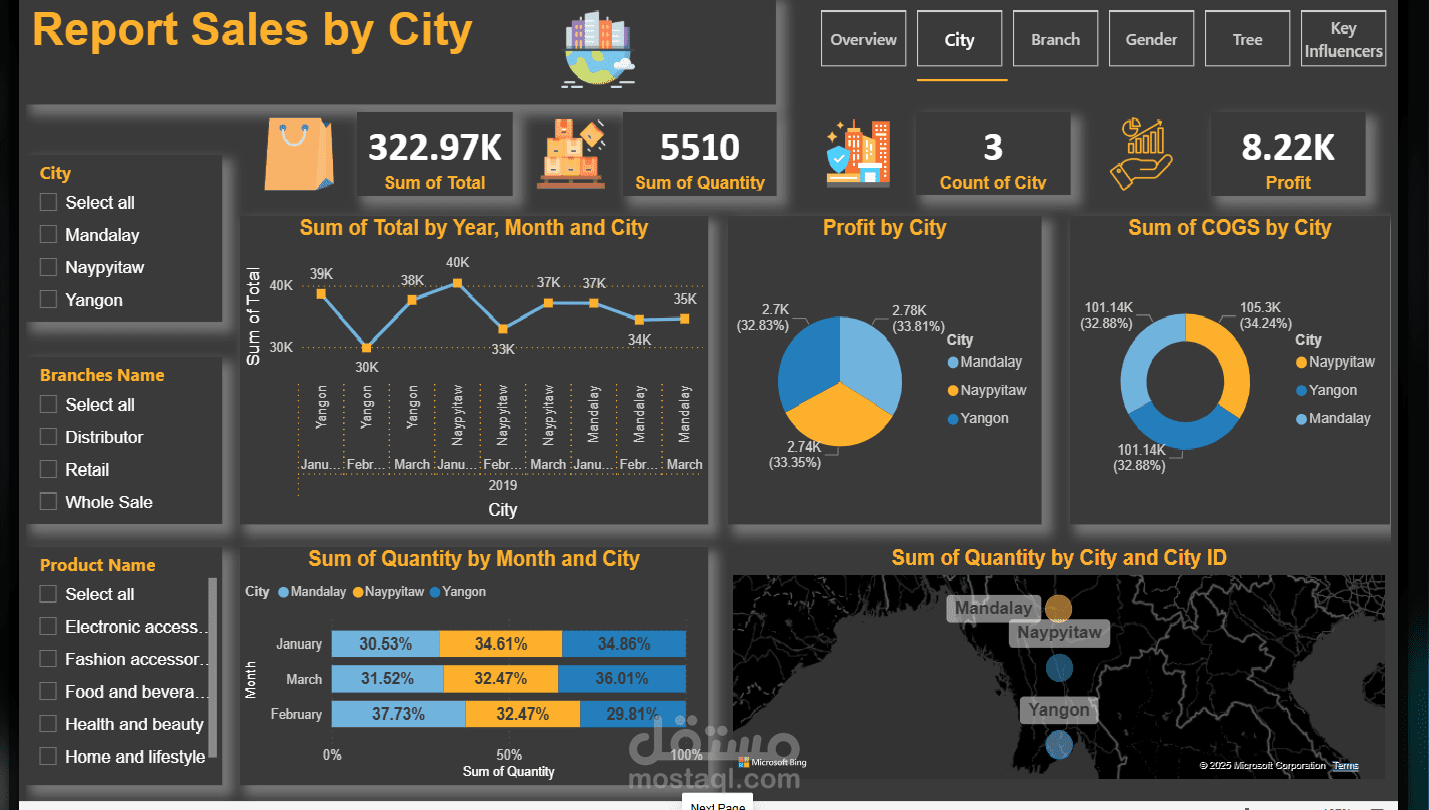
• Product Performance: Top-selling items, category comparisons, and contribution to overall sales.
• Customer Insights: Segmentation by demographics, purchase frequency, and loyalty indicators.
• Operational Metrics: Inventory turnover, supplier performance, and discount impact.
• Outcome:
The dashboard provided management with a comprehensive, real-time view of supermarket performance, enabling data-driven decisions such as optimizing stock levels, adjusting pricing strategies, and targeting promotions more effectively. The integration of Excel, Power Query, and Power BI ensured a seamless workflow from raw data to strategic insights.