Sales dashboard
تفاصيل العمل
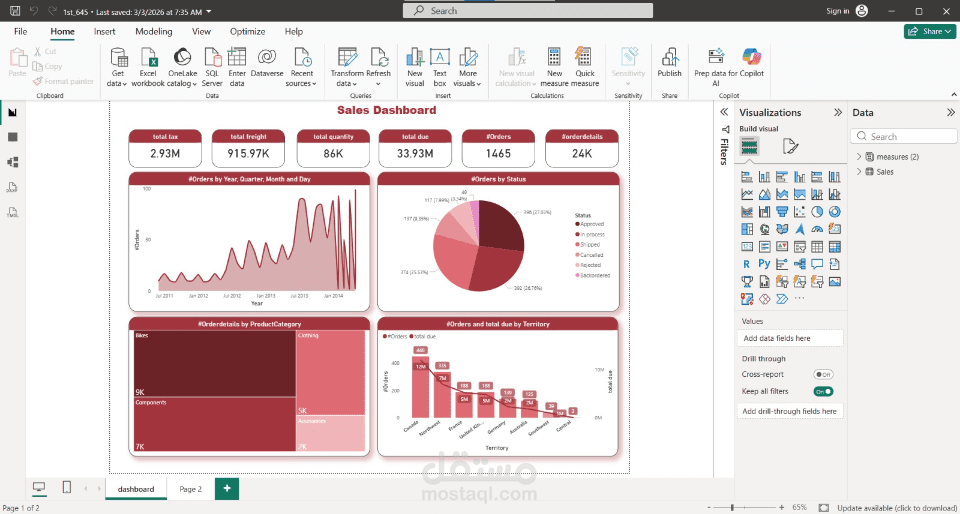
my second dashboard project and my first dashboard in powerBI
-total due reached 33.9M, with 1465 orders and 86k units sold
- (pie chart) we can see the number of status for order
-(line and column chart) the columns represent the number in each territory and the line for total due to each territory
-(treemap) number of order details for the category and their sub
_(line chart) shows us the number of orders in each year and each month ,
and total due tied with number of order in each point