Netflix Data Analysis Project
تفاصيل العمل

Performed exploratory data analysis on a Netflix dataset using Python (pandas, NumPy, matplotlib, seaborn) to identify content trends and key metrics.
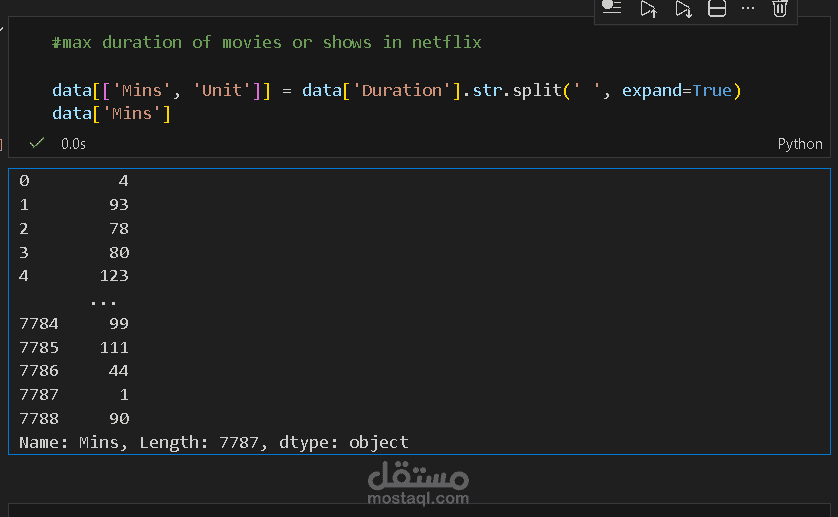
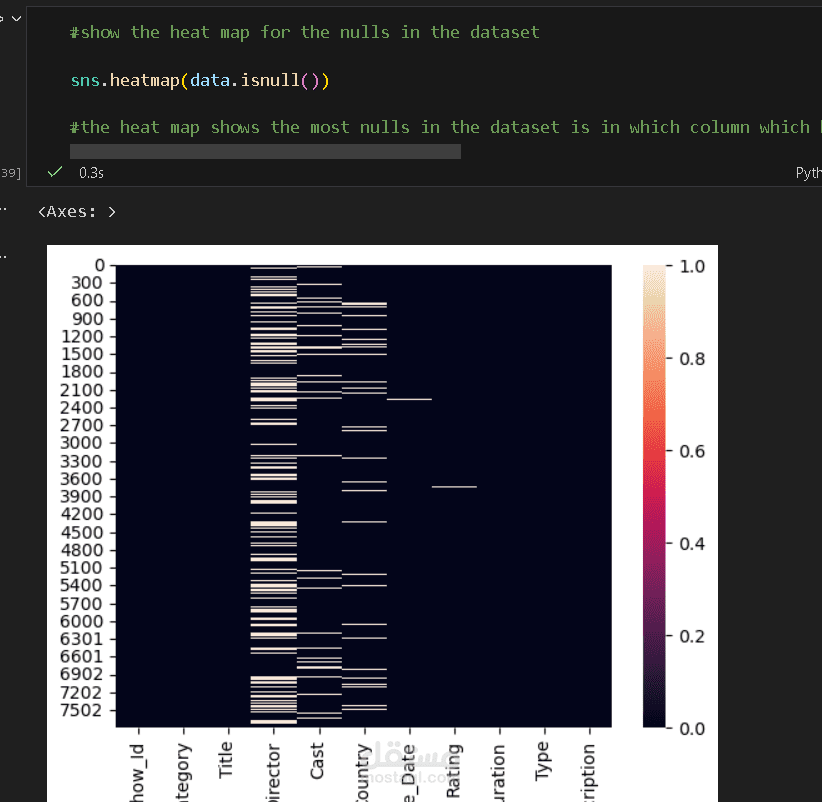
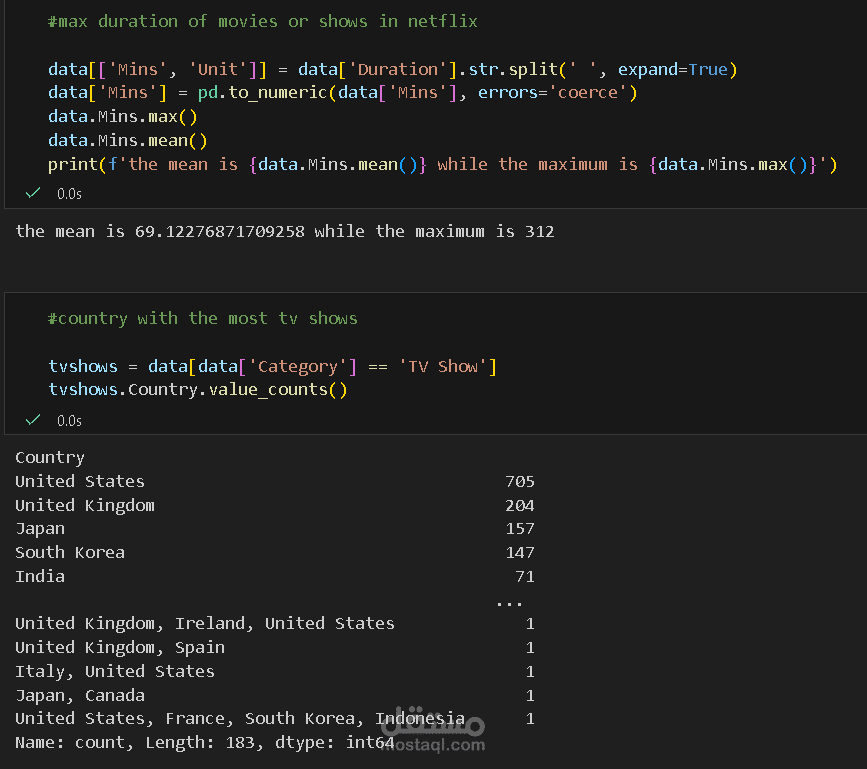
Cleaned and transformed data: handled missing values, converted release dates to datetime, extracted year, and split duration into numeric minutes and unit (movie runtime vs. TV show seasons).
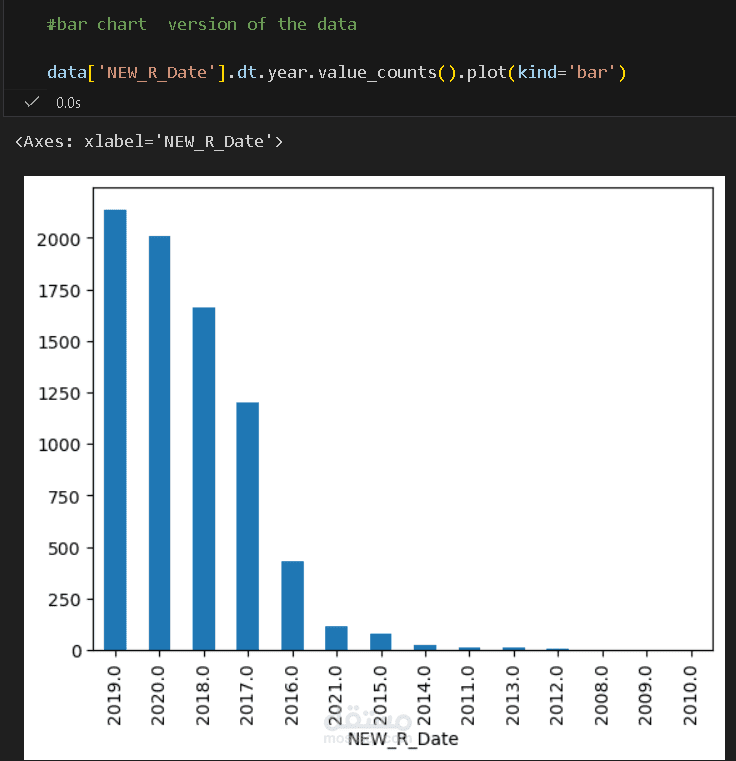
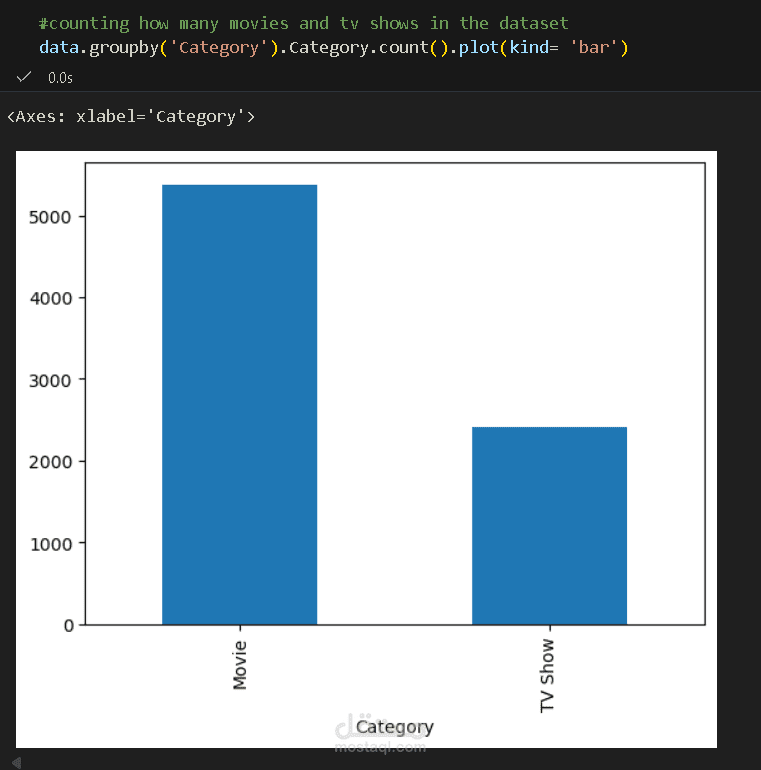
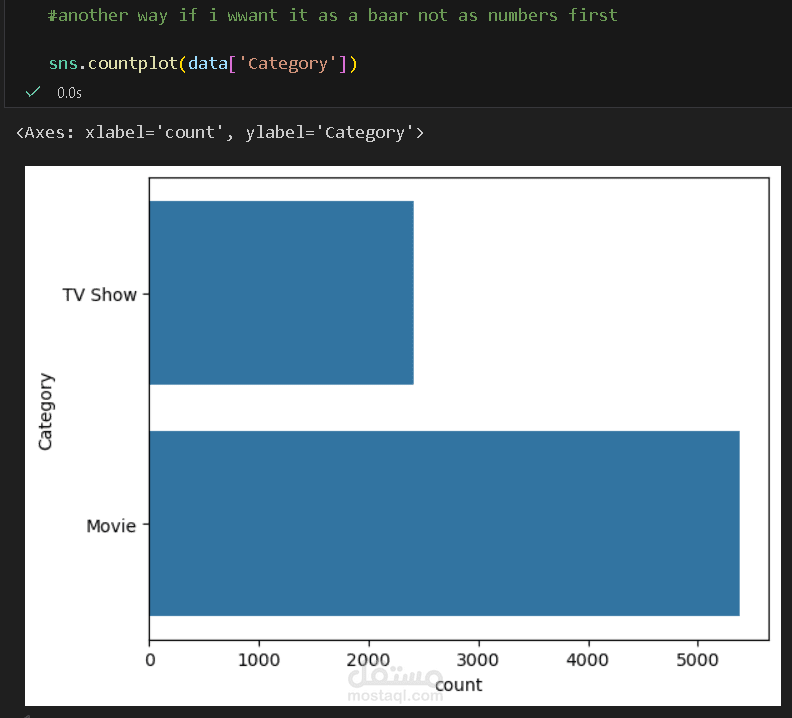
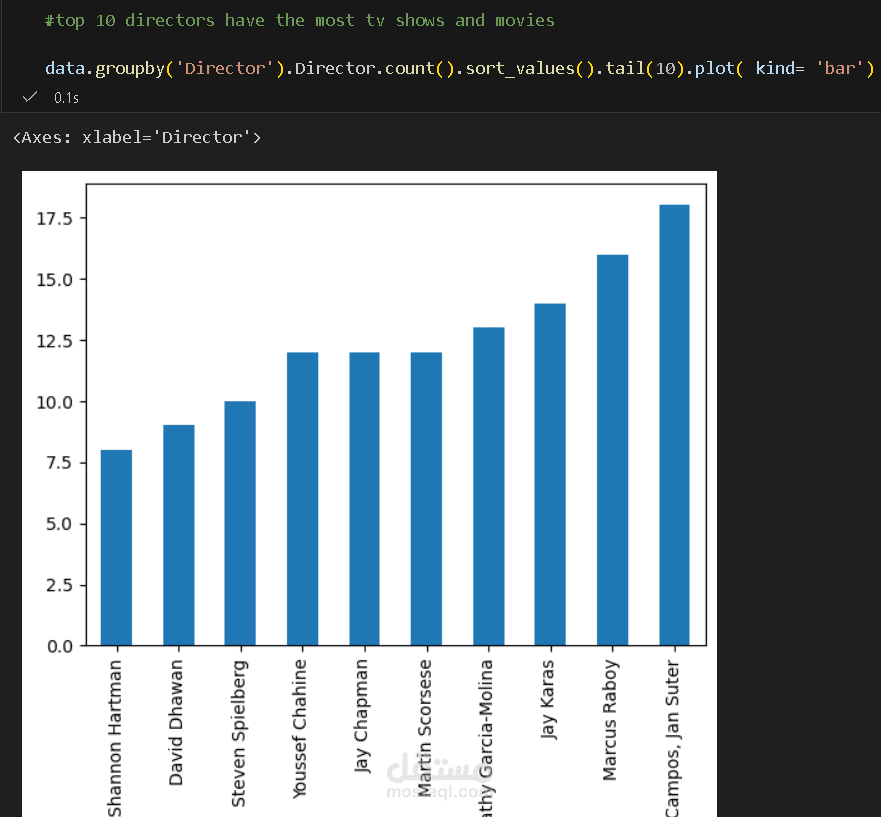
Visualized insights: year‑wise additions (peak in 2019), category distribution (movies > TV shows), top directors, most frequent rating (TV‑MA), and countries with highest TV show production (USA leads).
Computed statistics: average movie runtime ≈69 minutes, maximum runtime 312 minutes, and identified the United States as the top content producer.