Power BI dashboard for call center project
تفاصيل العمل
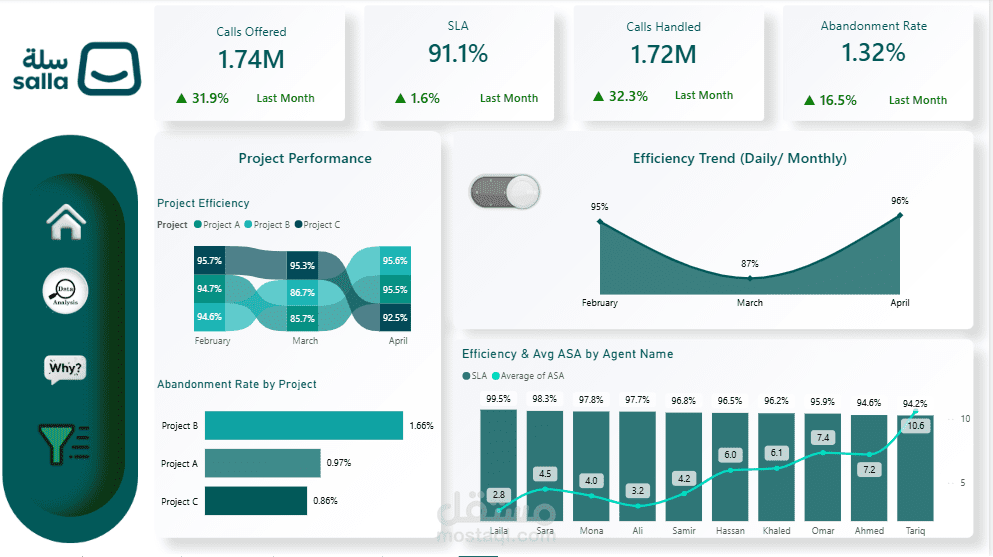
I developed an interactive dashboard analysing three projects(A,B,C) over three months(Feb,Mar,Apr
Key Highlights:
Project Rankings &SLA Trends:Ribbon and Line charts with toggle button show efficiency Over time,with detailed agent performance tooltips.
Abandon Rate Insights:Bar Charts and Drill through reveal why project project B had the highest abandon rate,with a decomposition tree for agent-level insights and aline chart showing trends by month and day by toggle button.Notably, high abandon rates on saturdays in February and March improved in April.
What-if-Scenarios: Adjustable Parameters to explore the impact of agent numbers ana ASA on Abandon rates.
This interactive dashboard provides actionable insights for project performance and SLA monitoring.