التنبؤ بتوليد الكهرباء النظيفه فى مصر فى 2026وتحليلها من 2016الى 2025
تفاصيل العمل
import pandas as pd
import matplotlib.pyplot as plt
from autots import AutoTS
# 1. تحميل البيانات من ملف CSV
df = pd.read_csv(r"C:\Users\AbdoM.DESKTOP-66G0QS0\OneDrive\Desktop\EGY_Generation_clean.csv",parse_dates=True)
df.tail(5)
#'Electricity generation [Clean] (TWh)'
df['Date']=pd.to_datetime(df['Date'],errors='coerce')
model = AutoTS(
forecast_length=3,
frequency='infer',
num_validations=1,
max_generations=2,
transformer_list='fast',
model_list='superfast',
ensemble='simple',
random_seed=42,
)
df = df[['Date','Electricity generation [Clean] (TWh)']].rename(columns={'Date':'date','Electricity generation [Clean] (TWh)':'value'})
# 3️⃣ تحويل السنة إلى تاريخ
df['date'] = pd.to_datetime(df['date'], )
# 4️⃣ التأكد أن القيمة رقمية (إزالة أي نصوص أو فراغات)
df['value'] = pd.to_numeric(df['value'], errors='coerce')
# 5️⃣ حذف أي صفوف فيها قيم مفقودة
df = df.dropna()
# 6️⃣ تشغيل AutoTS على السلسلة الزمنية
model = AutoTS(
forecast_length=18, # عدد السنوات للتنبؤ
frequency='infer', # البيانات سنوية
ensemble='simple', # نوع النموذج
model_list="fast",max_generations=3,num_validations=2,random_seed=42 # قائمة النماذج
)
model = model.fit(df, date_col='date', value_col='value')
prediction = model.predict()
forecast= prediction.forecast
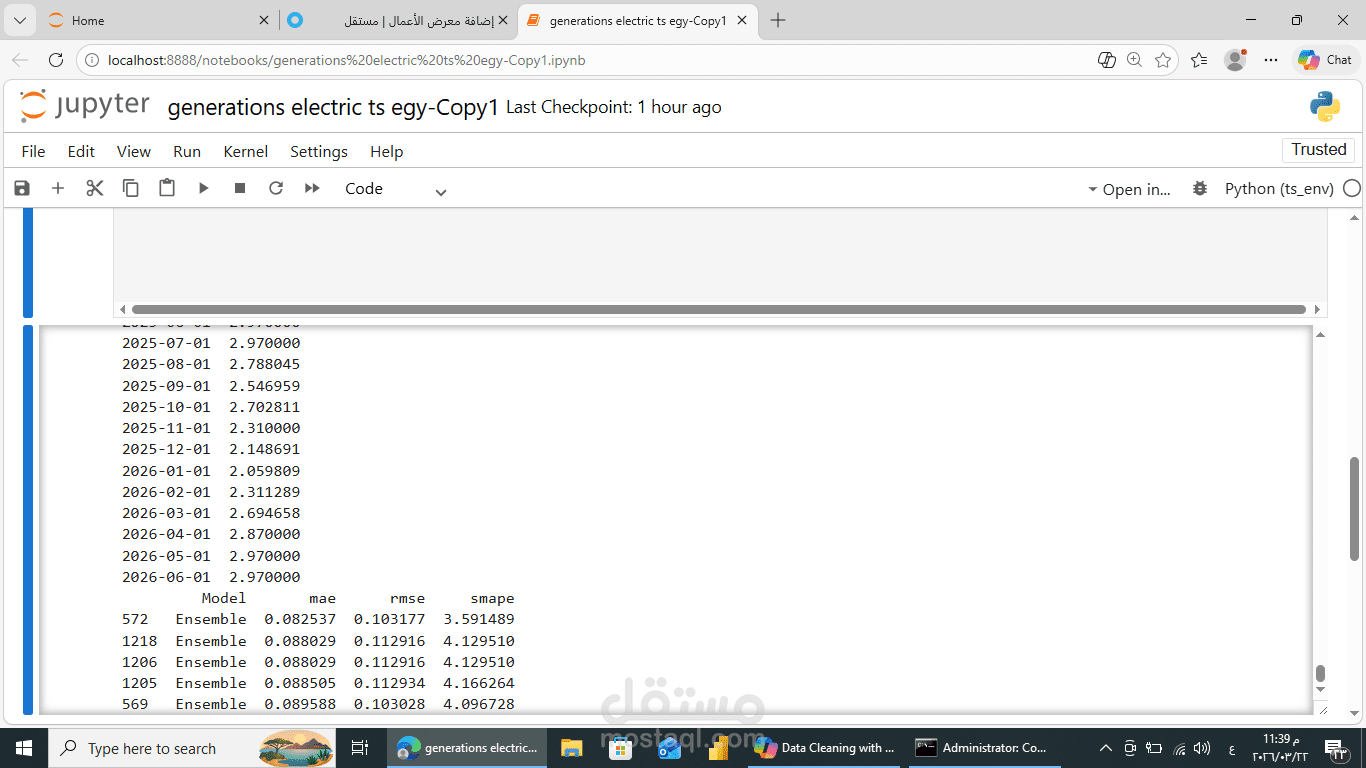
# 7️⃣ عرض التنبؤات
print("Forecasted values:")
print(prediction.forecast)
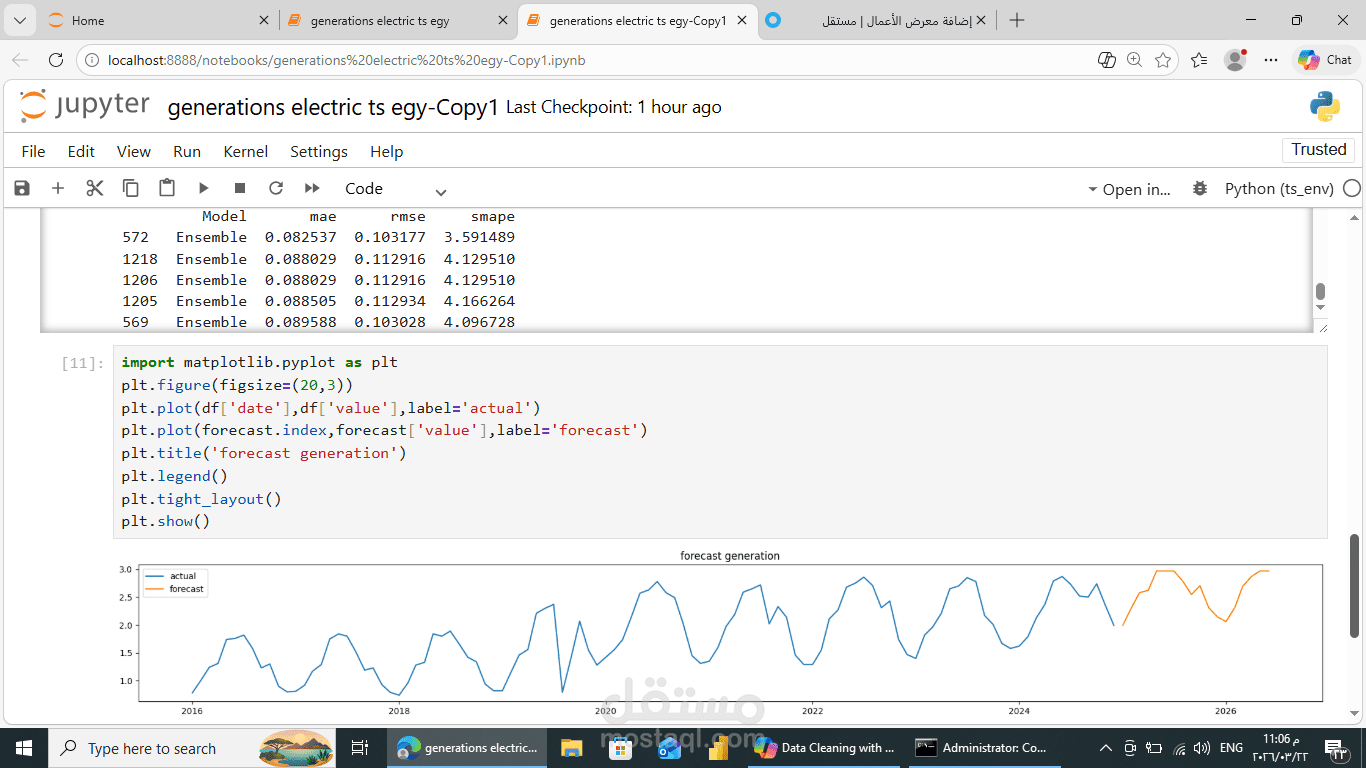
رسم واظهار الارقام الحقيقية والمتوقعة 2026
import matplotlib.pyplot as plt
plt.figure(figsize=(20,3))
plt.plot(df['date'],df['value'],label='actual')
plt.plot(forecast.index,forecast['value'],label='forecast')
plt.title('forecast generation')
plt.legend()
plt.tight_layout()
plt.show()