Sales Analysis Dashboard
تفاصيل العمل
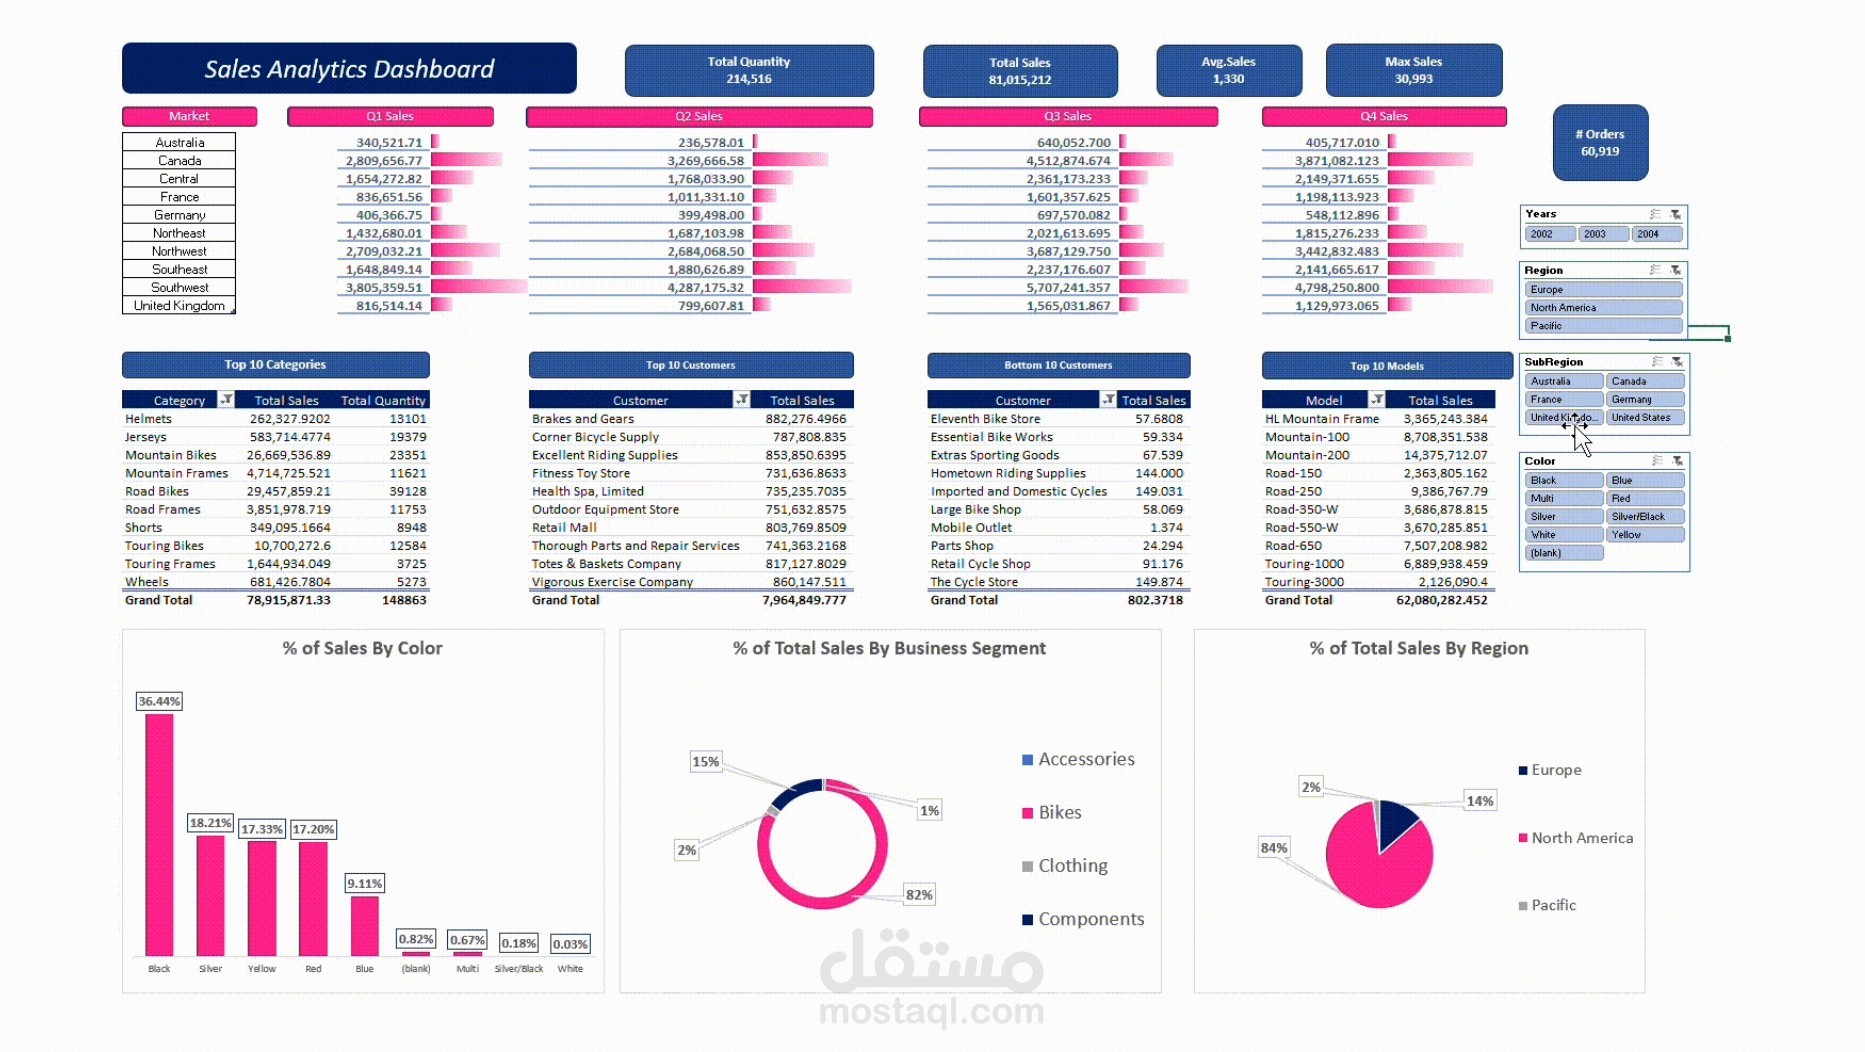
A client needed a comprehensive Excel dashboard to track sales performance across multiple regions, product categories, and time periods. I designed an interactive dashboard using pivot tables, slicers, and advanced charting to provide a clear overview of business performance. The dashboard highlights:
Sales by region, category, and product model
Top and bottom customers
Key KPIs including total sales, total quantity, average sales, and number of orders
Sales breakdown by color and business segment
The final dashboard allowed the client to filter data dynamically and monitor business trends, helping them identify top performers, weak areas, and overall market opportunities.