Needs Analysis Dashboard
تفاصيل العمل
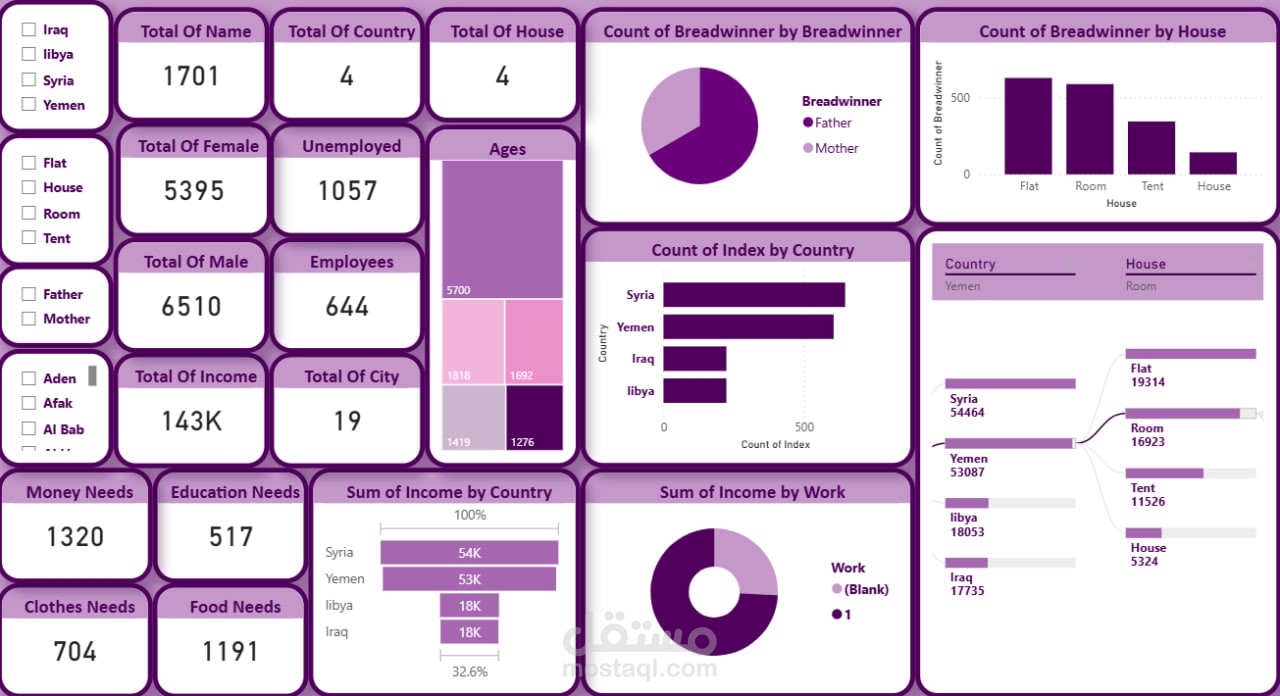
A comprehensive data visualization project focused on analyzing the demographic and socioeconomic needs of displaced or vulnerable populations across four countries (Syria, Yemen, Iraq, and Libya).
Key Features:
Demographic Breakdown: Visualized data for over 11,000 individuals, categorized by gender (6,510 Males / 5,395 Females) and employment status.
Needs Assessment: Tracked urgent requirements including Food needs (1,191), Money needs (1,320), Clothes, and Education.
Living Conditions: Analyzed housing types (Tents, Flats, Rooms, Houses) to identify the most vulnerable groups living in temporary shelters.
Economic Analysis: Monitored total income distribution by country and analyzed the "Breadwinner" status (Father/Mother) within families.
Geographical Mapping: Covered data from 19 different cities across the region to provide a localized understanding of the crisis.
Tools Used: Power BI for complex data mapping, hierarchy visuals , and interactive filtering.