? العنوان (Title) Advanced Tea Sales Analysis Dashboard | Business Intelligence Report (Power BI)
تفاصيل العمل
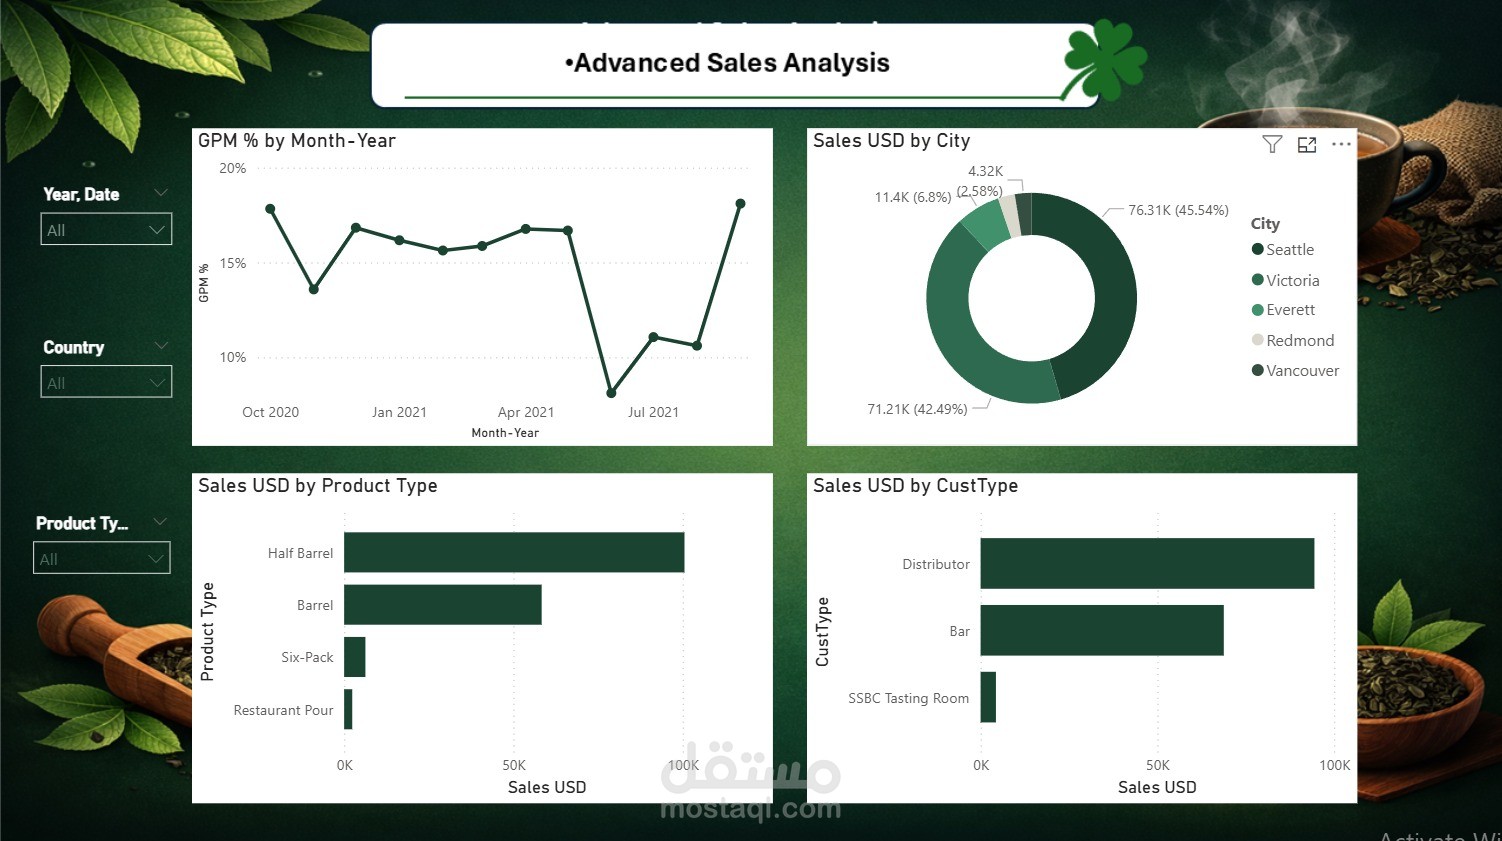
An advanced Tea Sales Analysis Dashboard built to provide comprehensive business insights and support data-driven decision-making.
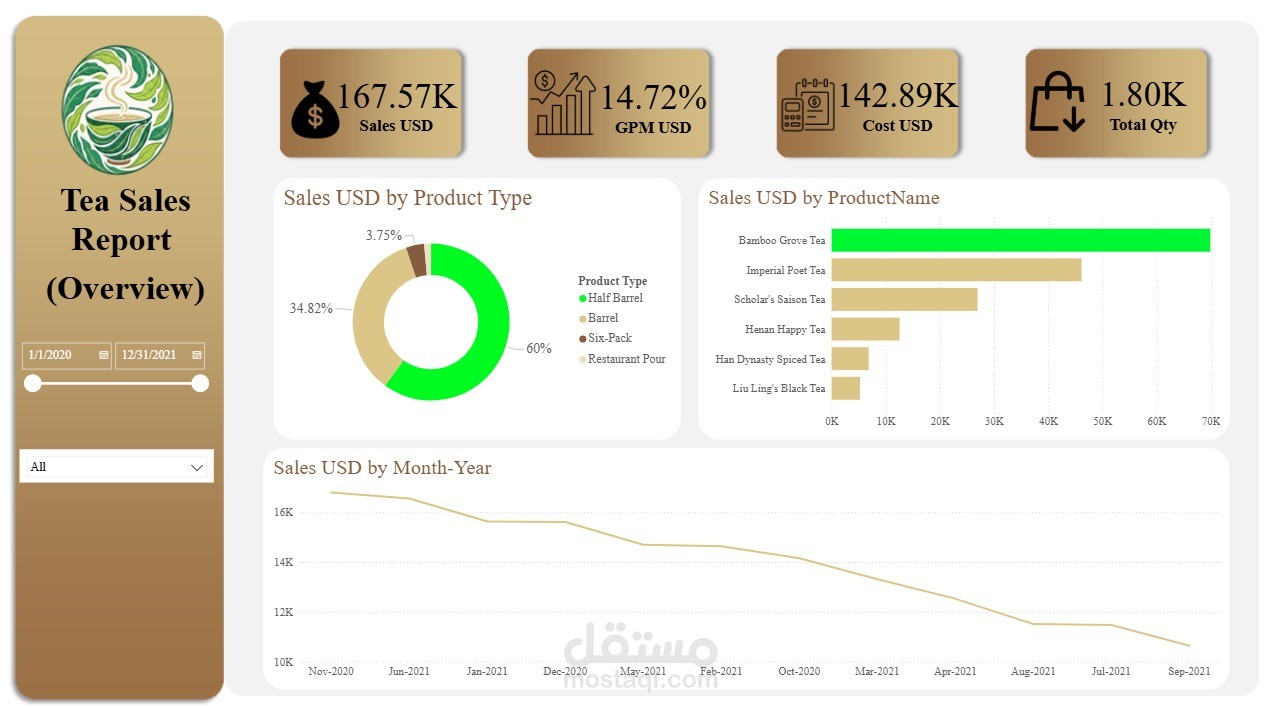
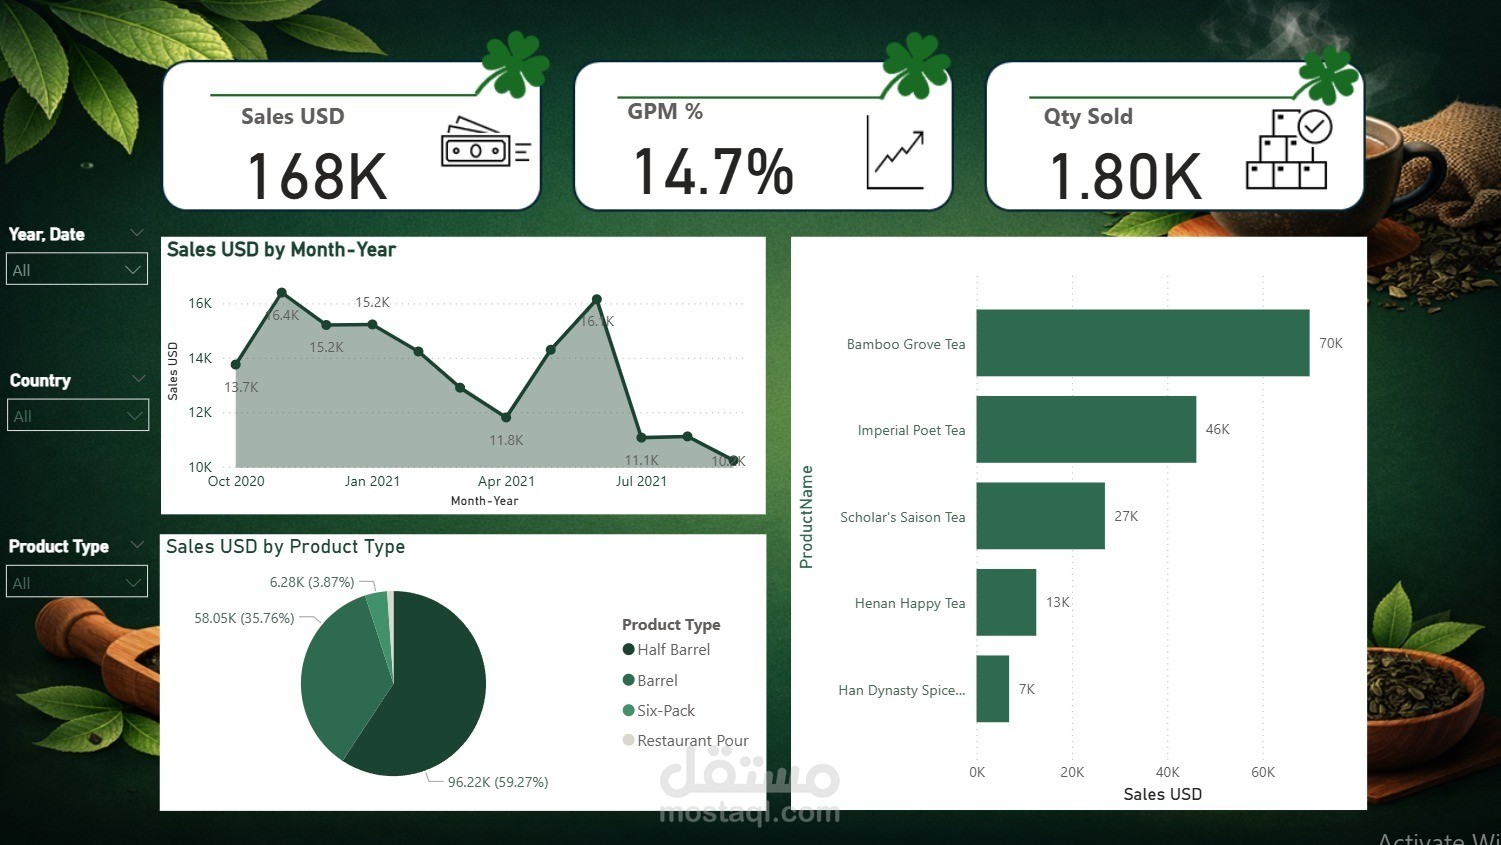
This interactive report delivers a complete overview of sales performance, profitability, and customer behavior.
Key Features:
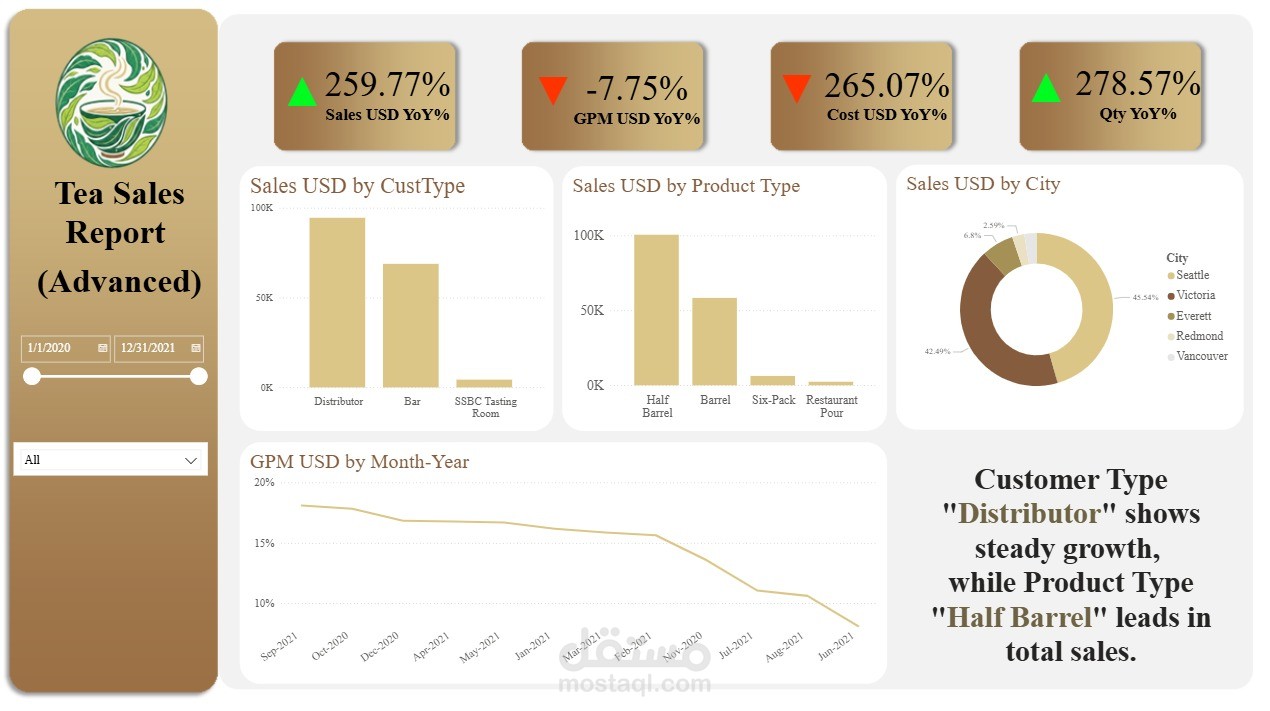
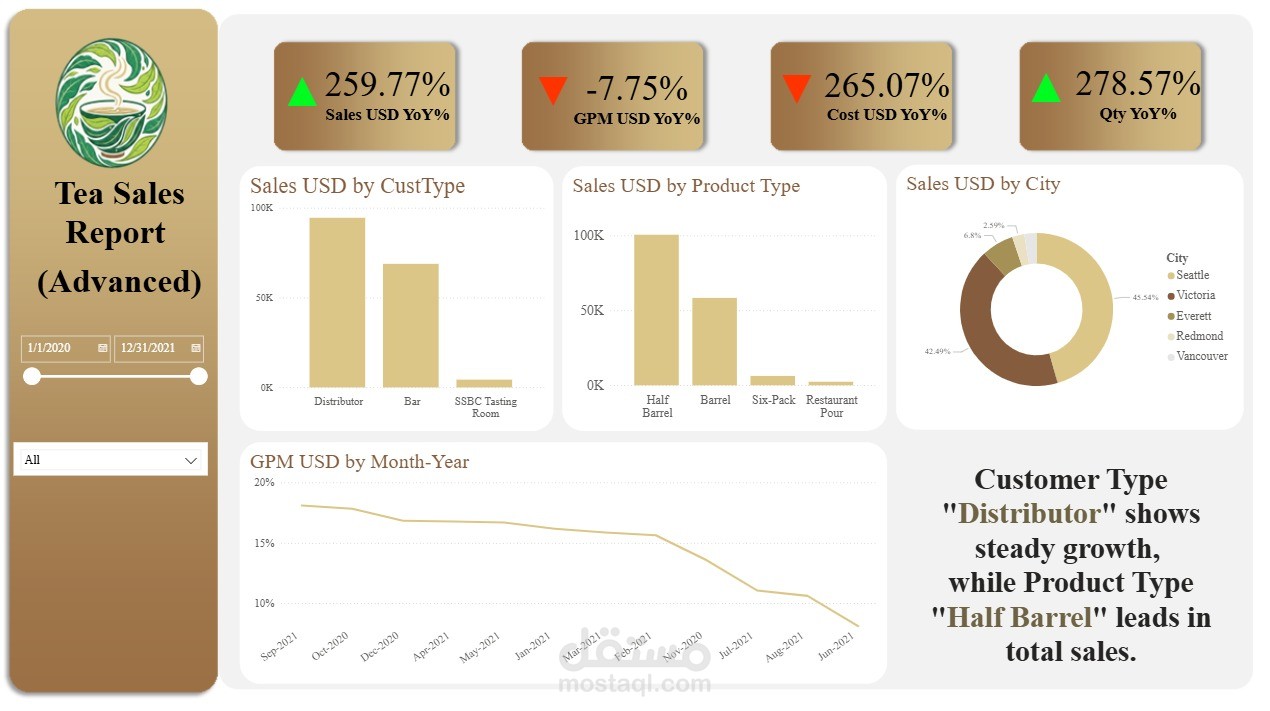
Year-over-Year (YoY) analysis for Sales, Cost, Quantity, and Profit Margin
Sales breakdown by customer type (Distributor, Bar, etc.)
Product performance analysis by category (Half Barrel, Barrel, etc.)
Geographical sales distribution by city
Profit Margin (GPM) trend analysis over time
Interactive filters for date and segmentation
Key Insights:
Strong growth in sales and quantity over time
Decline in profit margin despite revenue increase
"Distributor" segment drives the highest revenue
"Half Barrel" is the top-performing product category
Tools & Technologies:
Power BI
Excel
DAX
Data Modeling
This project highlights advanced data analysis, storytelling with data, and the ability to transform raw data into meaningful business insights.