Regional Sales Performance Analysis & Executive Dashboard
تفاصيل العمل
This project focuses on analyzing regional sales data for a distribution business to evaluate sales representative performance and regional market trends. The project involved transforming raw sales records into a structured analytical format and building a comprehensive dashboard to support data-driven management.
Key tasks performed:
Data Engineering & Structuring:
Processed raw datasets containing Order IDs, Sales Reps, and product categories.
Standardized regional data (East, North, South, West) for accurate comparison.
Calculated key metrics including Total Sales per order and unit profitability.
Advanced Data Analysis (PivotTables):
Aggregated total sales and quantities by Region to identify high-performing markets.
Performed Trend Analysis to track monthly sales fluctuations throughout the year.
Evaluated Sales Representative Performance to identify top-tier contributors (e.g., Sarah Johnson, David Wilson).
Analyzed product category distribution (Electronics, Furniture, Accessories).
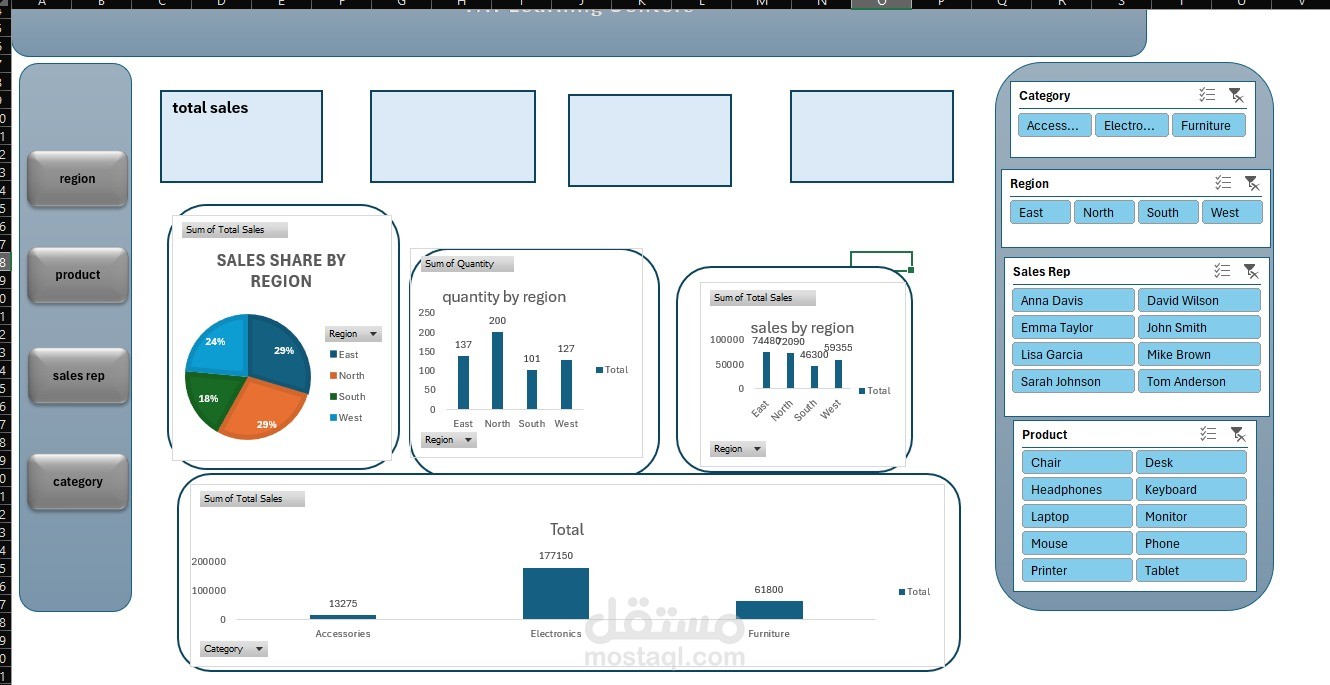
Interactive Visualization (Dashboard):
Developed a dynamic dashboard using PivotCharts to visualize sales distribution.
Integrated Slicers to allow users to filter data by Month, Region, or Product Category.
Designed a KPI summary showing total revenue (exceeding $252K) and total units sold.
Insights & Recommendations:
Regional Performance: Identified the "East" region as the primary revenue driver, while the "South" region showed opportunities for market expansion.
Product Strategy: Electronics emerged as the dominant category; recommended increasing inventory for top-selling items like Laptops and Phones.
Seasonal Trends: Detected significant sales spikes in specific months (e.g., February and December), suggesting the need for targeted seasonal marketing.
Team Optimization: Highlighted top-performing sales reps to share best practices across the team.
Tools Used: Excel, Advanced PivotTables, Data Modeling, PivotCharts, Slicers.