Interactive Sales Performance Analysis Dashboard | Power BI
تفاصيل العمل
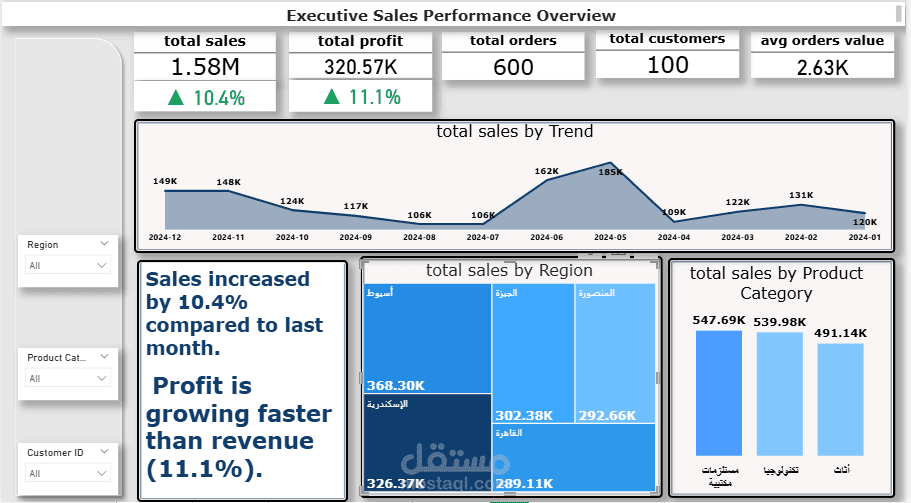
This project is an interactive Power BI dashboard designed to analyze sales performance and business trends across different regions and product categories.
The dashboard provides a comprehensive overview of key business metrics including total sales, profit, total orders, and average order value. It also analyzes monthly sales trends, regional performance, and product category contributions.
The analysis highlights seasonal sales patterns and identifies the cities contributing the highest share of revenue. Additionally, the dashboard evaluates performance variability, monthly growth rates, and the impact of order volume and discounts on overall revenue.
Key features of the dashboard include:
Executive sales performance overview
Monthly sales trend analysis
Regional sales performance
Product category analysis
Monthly growth rate analysis
Performance variability insights
This dashboard helps businesses understand sales behavior, identify growth opportunities, and make data-driven strategic decisions.