Coffee Shop Data Analysis & Interactive Dashboard
تفاصيل العمل
Description:
I have prepared a comprehensive analysis of a coffee shop’s sales data using Excel. The project covers the full data analysis workflow from data preparation to visualization, providing actionable insights to improve business performance.
Key tasks performed:
Data Preparation:
Cleaned and explored the transaction dataset.
Calculated Revenue for each transaction (unit_price × transaction_qty).
Extracted additional time-based fields: Month, Day of Week, Hour for detailed analysis.
PivotTables Analysis:
Summarized Revenue by Month.
Counted Transactions by Day of Week and Hour of Day.
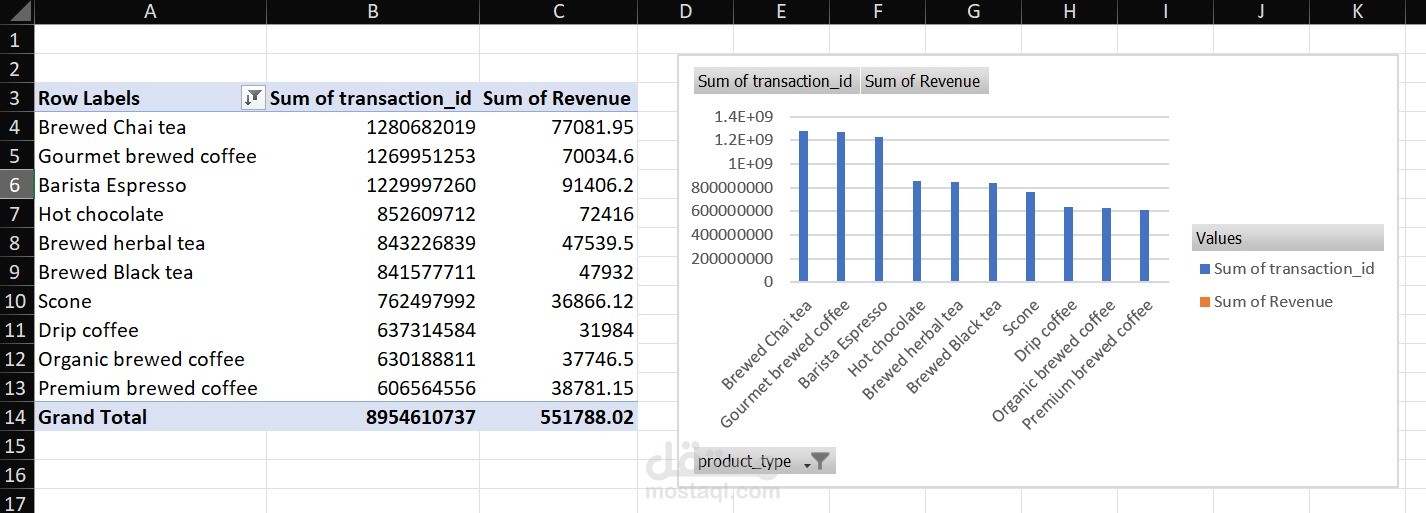
Analyzed Transactions by Product Category sorted by popularity.
Identified Top 15 Product Types based on transactions and revenue.
Interactive Dashboard:
Created PivotCharts:
Revenue by Month (Line Chart)
Transactions by Day and Hour (Column Charts)
Transactions by Product Category (Bar Chart)
Assembled an interactive dashboard layout.
Added Slicer for Store Location to filter all charts dynamically.
Polished formatting and layout for professional presentation.
Insights & Recommendations:
Identified peak sales hours and days to optimize staffing and preparation.
Highlighted top-selling products and categories to guide marketing and promotions.
Provided suggestions for inventory and stock management based on product performance trends.
Tools Used: Excel, PivotTables, PivotCharts, Slicers.