تحليل لشركه ادويه ومستحضرات
تفاصيل العمل
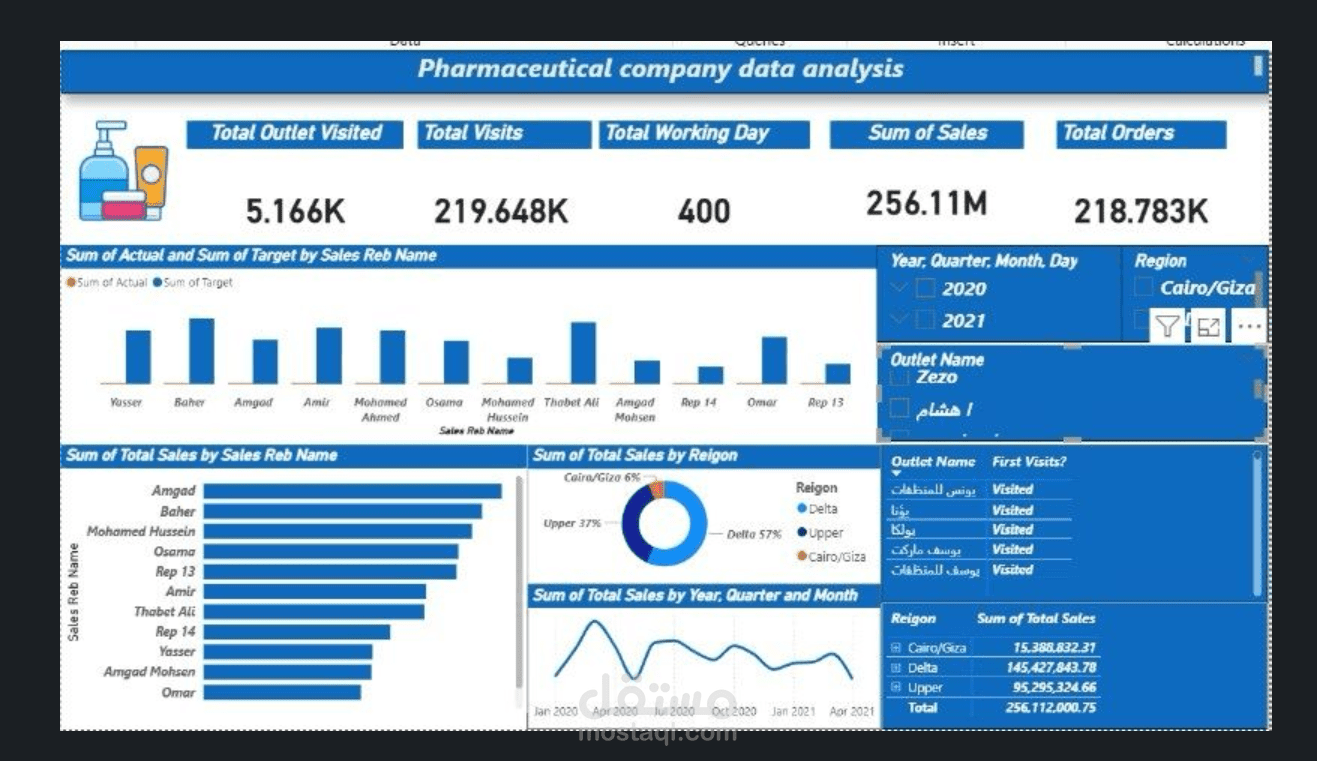
1. Operational KPIs
Engagement Metrics: Tracks 5,166 total outlets visited and a massive 219,648 total visits over 400 working days.
Financial Impact: Highlights $256.11M in total sales generated from 218,783 total orders.
2. Sales Representative Performance
Actual vs. Target: A clustered column chart compares individual sales reps (e.g., Yasser, Baher, Amgad) against their specific targets, allowing managers to identify top performers instantly.
Sales Ranking: A bar chart ranks representatives by total sales, showing Amgad and Baher as the leading contributors.
3. Regional & Distribution Analysis
Market Share: A donut chart shows the Delta region as the strongest market (57%), followed by Upper Egypt (37%) and Cairo/Giza (6%).
Outlet Monitoring: A dedicated table tracks individual outlets (e.g., Zezo, Hisham) and their "First Visit" status to monitor market expansion.
4. Time Series & Filtering
Sales Trends: A line chart visualizes sales fluctuations from January 2020 through April 2021.
Interactivity: Includes robust slicers for Year/Quarter/Month, Region, and specific Outlet Names for deep-dive analysis.