Interactive Student Performance Dashboard using Excel
تفاصيل العمل
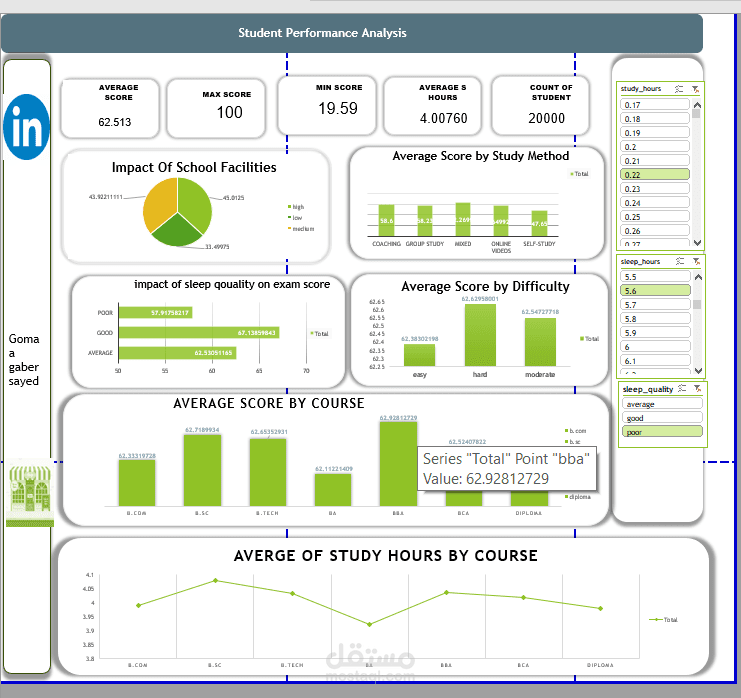
This project presents an interactive Student Performance Analysis Dashboard built using Microsoft Excel. The dashboard analyzes student academic performance and provides valuable insights into different factors that influence students' results.
The dashboard includes key performance indicators such as average scores, maximum scores, minimum scores, and student count. It also visualizes important relationships such as the impact of study hours, sleep quality, school facilities, and course difficulty on student performance.
Through clear and interactive visualizations, this dashboard helps educators and analysts better understand student performance patterns and identify areas that may require improvement.
Key features of the dashboard include:
- Overview of student performance metrics
- Analysis of study hours and academic results
- Impact of school facilities on student performance
- Performance comparison across different courses
- Interactive filters for better data exploration
Tools Used:
Microsoft Excel, Data Analysis, Data Visualization