Interactive Sales Performance Dashboard using Power BI
تفاصيل العمل
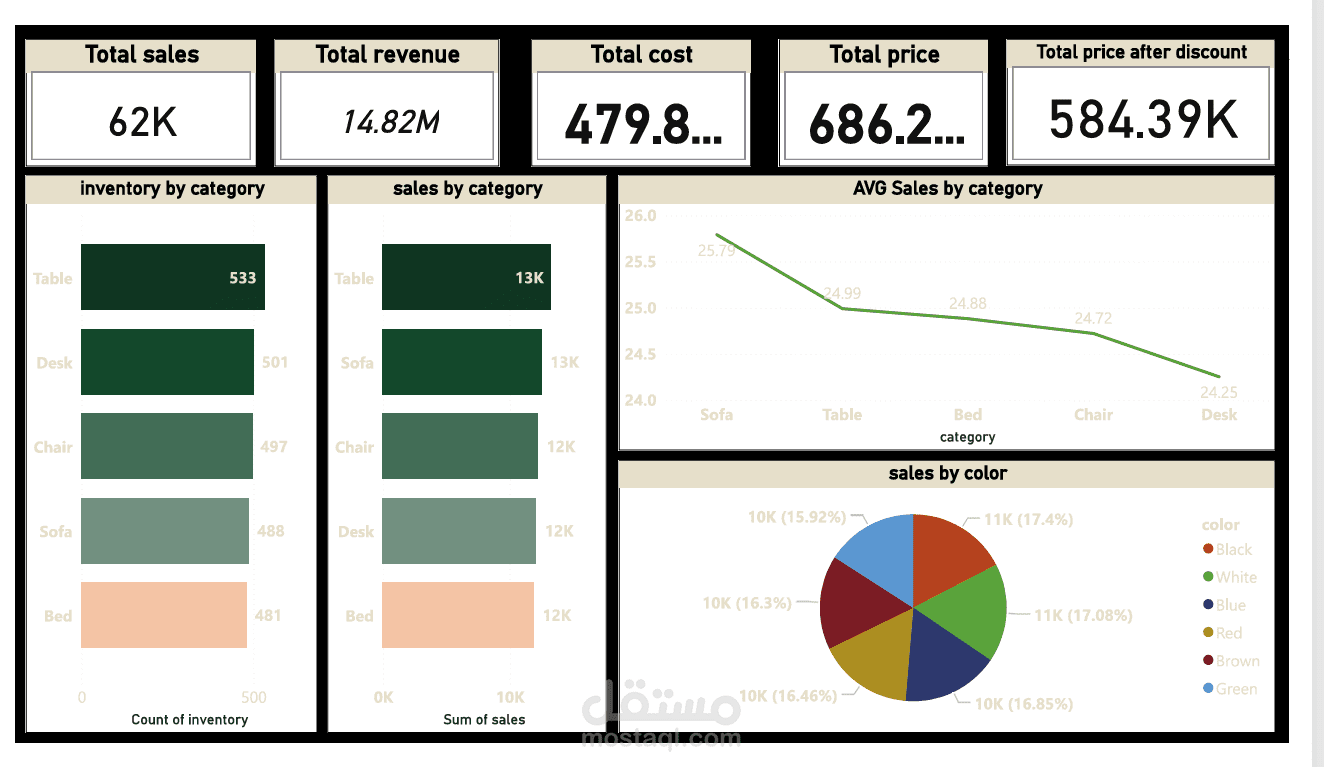
This project presents an interactive Sales Performance Dashboard built using Power BI to analyze business sales data and provide clear insights into overall performance.
The dashboard highlights key performance indicators such as Total Sales, Total Revenue, Total Cost, and Total Profit. It also visualizes sales trends and comparisons through multiple charts including sales by season, product category, and location.
The purpose of this dashboard is to help businesses understand their sales performance, identify trends, and make better data-driven decisions.
Key features of the dashboard include:
- Sales performance overview through key KPIs
- Sales analysis by product categories
- Sales comparison by location
- Seasonal sales trends analysis
- Interactive and easy-to-read data visualizations
Tools Used:
Power BI, Data Analysis, Data Visualization