Business Sales & Profit Analytics Dashboard (Data Visualization Project)
تفاصيل العمل
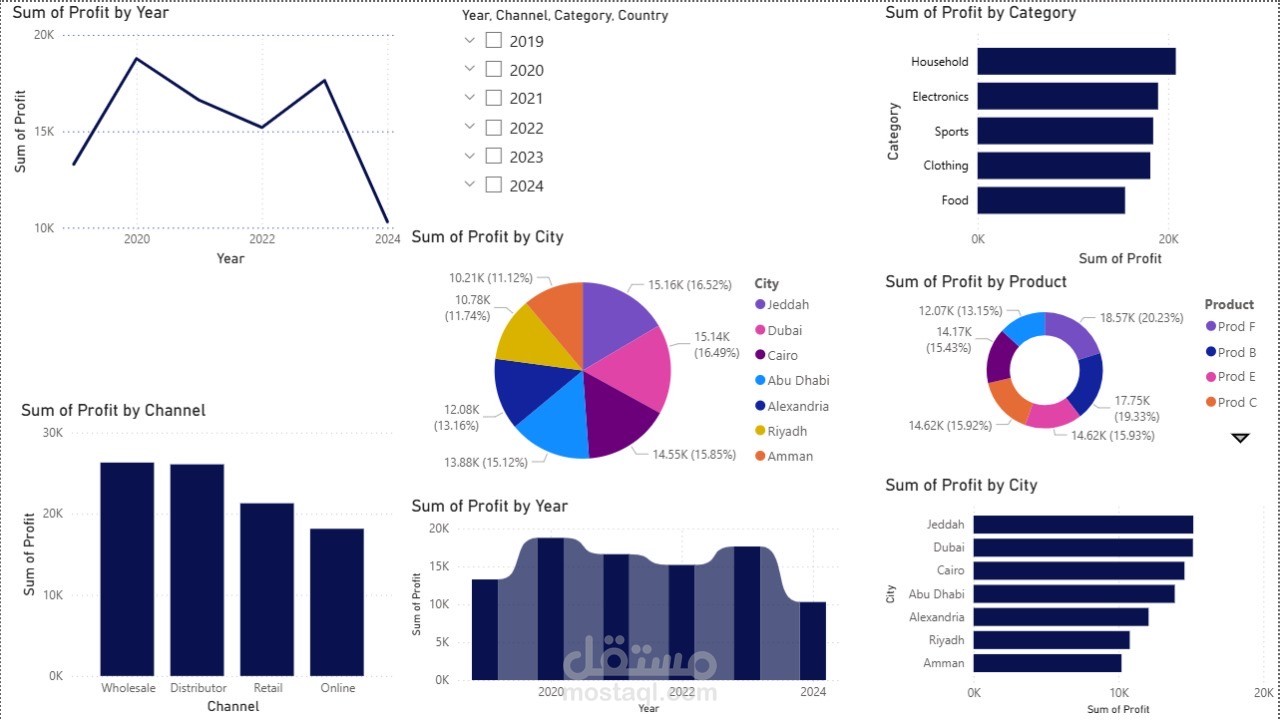
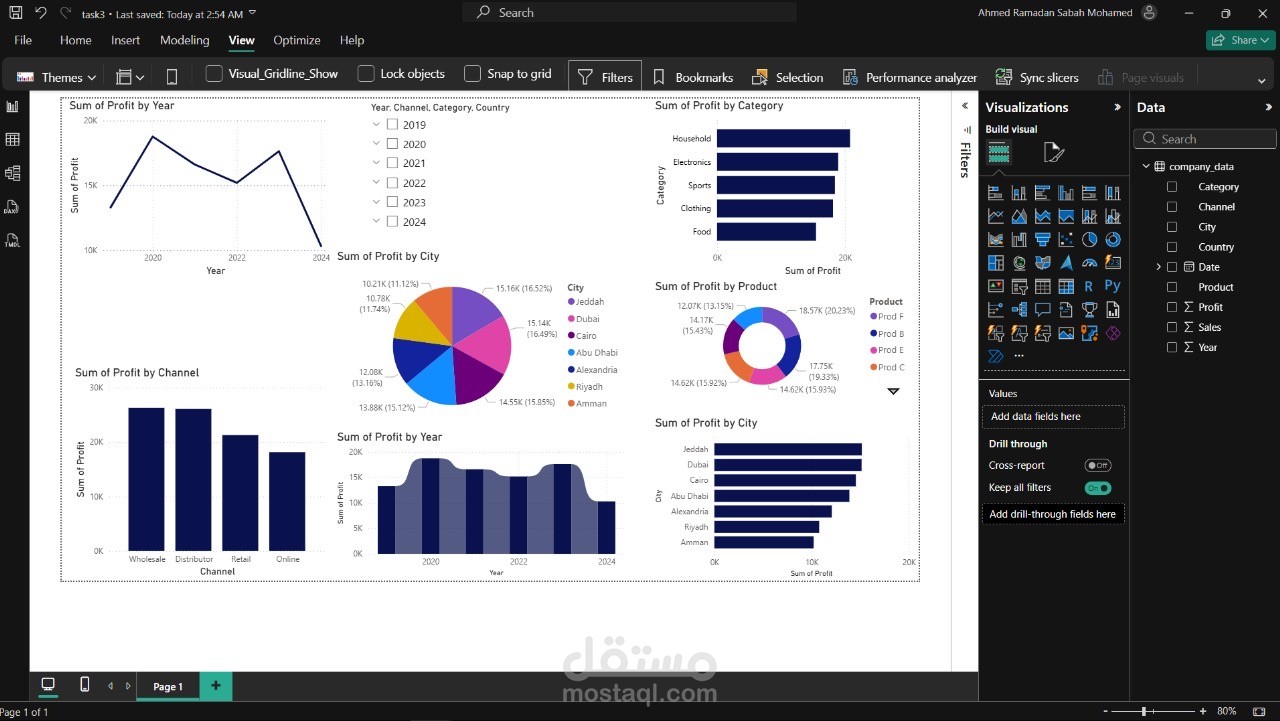
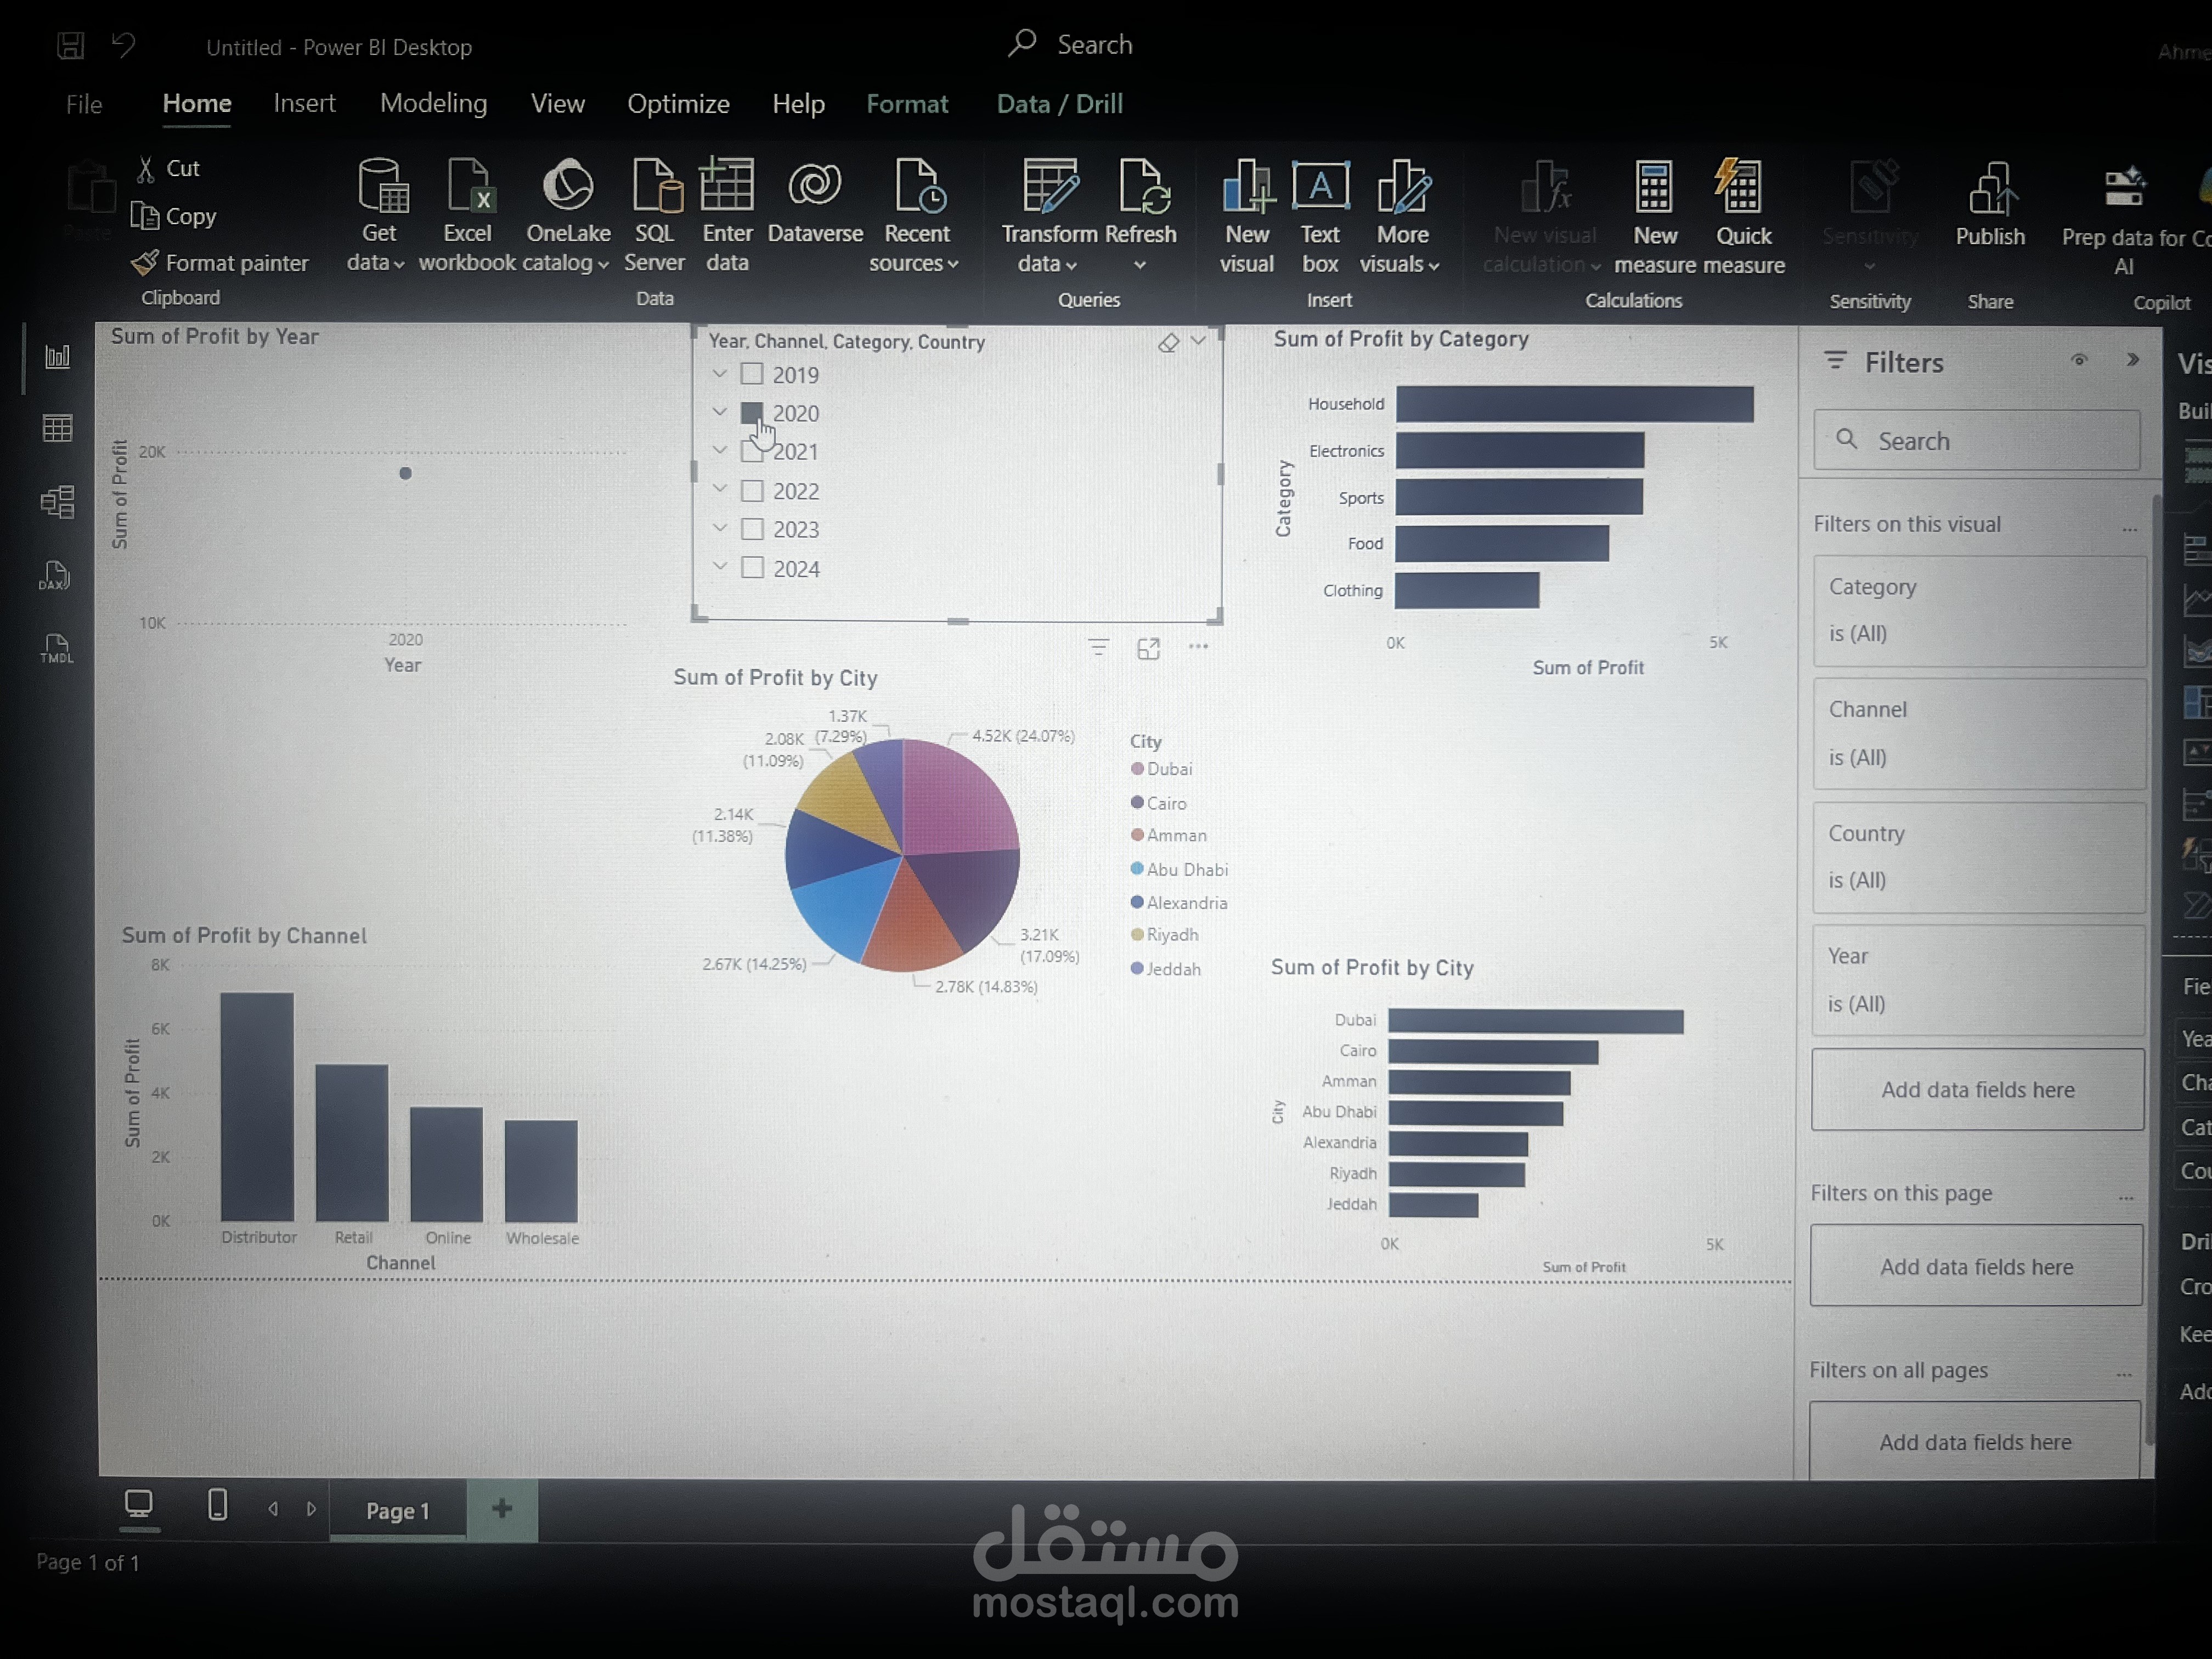
In this project, I designed an interactive data dashboard to analyze sales and profit performance across multiple dimensions such as year, city, product, category, and sales channel.
The dashboard includes visualizations like line charts, bar charts, and pie charts to help identify trends and compare performance across regions and product categories. This project demonstrates my ability to transform raw data into clear and meaningful insights using data visualization tools