Transforming data into simple insights with Power BI?
تفاصيل العمل
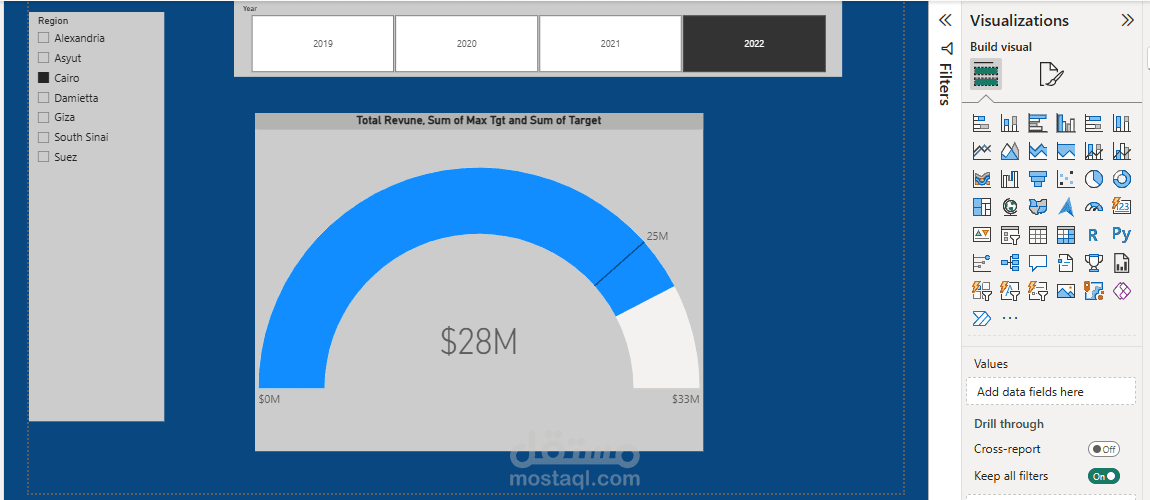
This simple visual highlights each region’s target versus actual achieved revenue. By selecting the year, the dashboard dynamically updates to show performance across regions, making it easier to track progress and quickly understand how each region is performing against its target.