Productivity & Marketing Performance Analysis
تفاصيل العمل
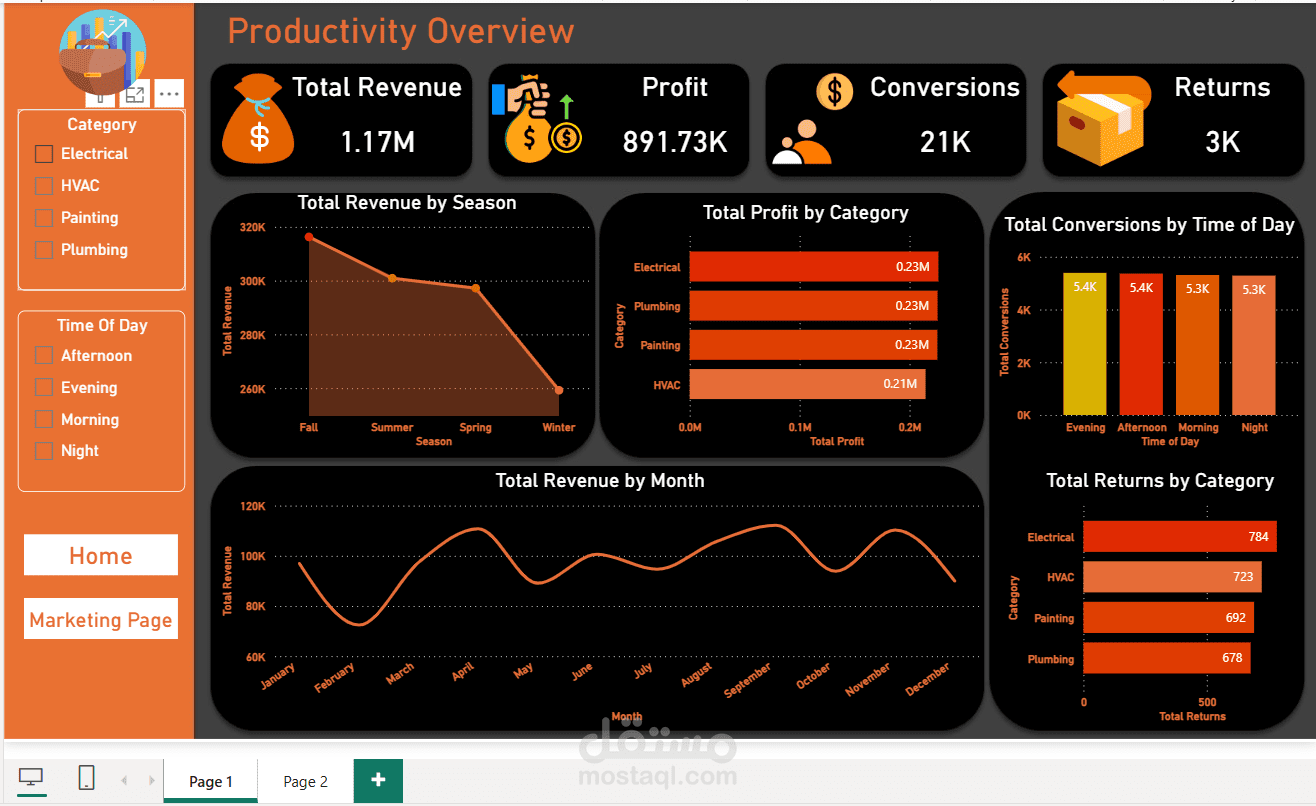
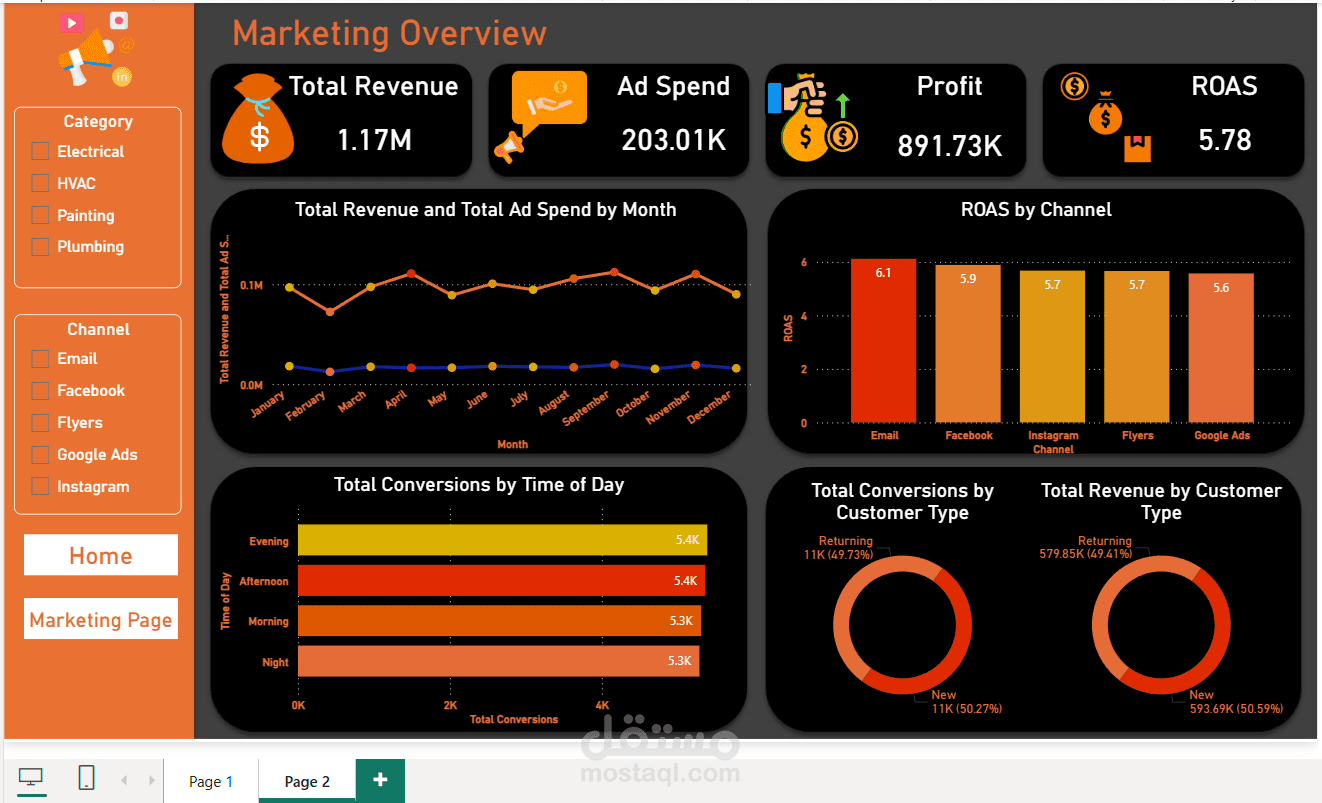

A Power BI project focused on analyzing business and marketing
performance through two
interactive dashboards (Marketing Overview and Productivity
Overview). The dashboards
present key KPIs such as total revenue, profit, ad spend,
conversions, ROAS, and returns, with
dynamic analysis by marketing channel, customer type (new vs
returning), category, time of
day, and season. The project includes data cleaning and modeling in
Power BI Desktop,
creating custom DAX measures to calculate profit and ROAS, and
designing a professional,
insight-driven dashboard that supports decision-making by
tracking monthly performance,
comparing channels, and identifying the most profitable periods
and categories.