Turning Data into Insights ?
تفاصيل العمل
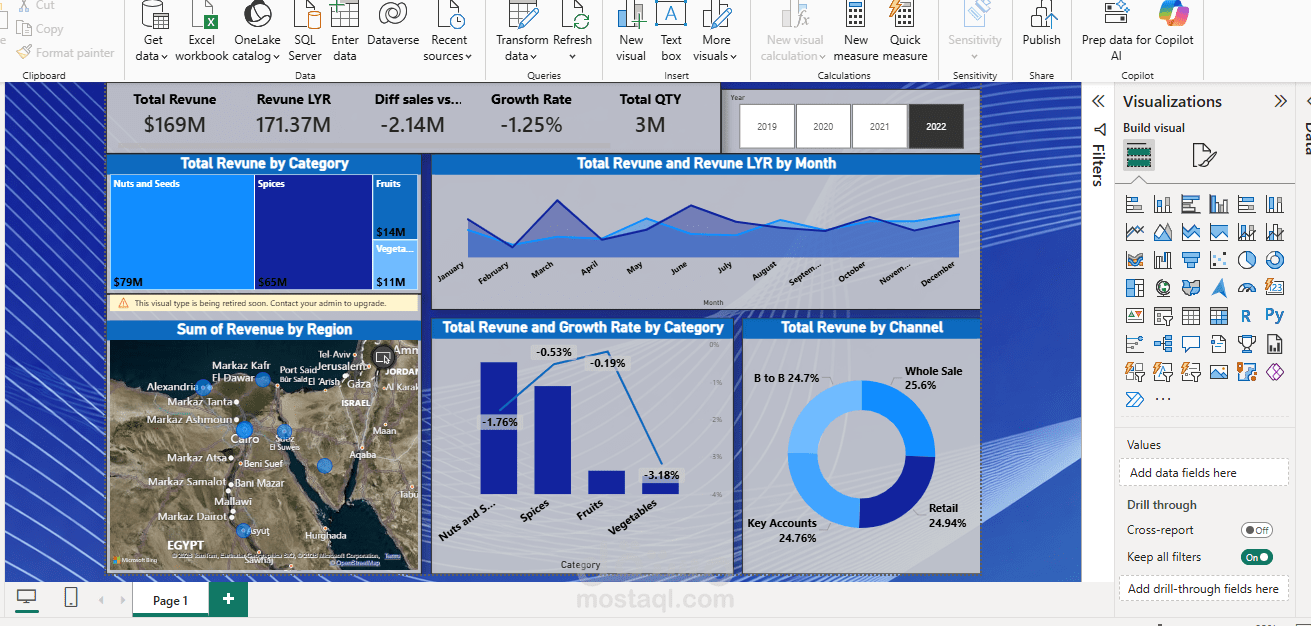
building this interactive Sales & Revenue Dashboard using Power BI to analyze business performance across multiple dimensions.
The dashboard provides a comprehensive view of:
• Total Revenue and Year-over-Year comparison
• Monthly revenue trends and performance changes
• Revenue contribution by product category
• Regional sales distribution using geospatial analysis
• Growth rate analysis across categories
• Revenue breakdown by sales channel
Through this analysis, I focused on transforming raw data into clear and actionable insights that help decision-makers quickly understand performance trends, identify growth opportunities, and detect areas that require attention.
From data cleaning and modeling to visualization design, the goal was to create a dashboard that is not only informative but also intuitive and easy to interpret.
Data analytics is not just about numbers
it’s about telling a story that supports smarter business decisions.