Interactive Excel Sales Dashboard
تفاصيل العمل
Technologies & Techniques Used
This dashboard was meticulously crafted leveraging powerful Excel functionalities:
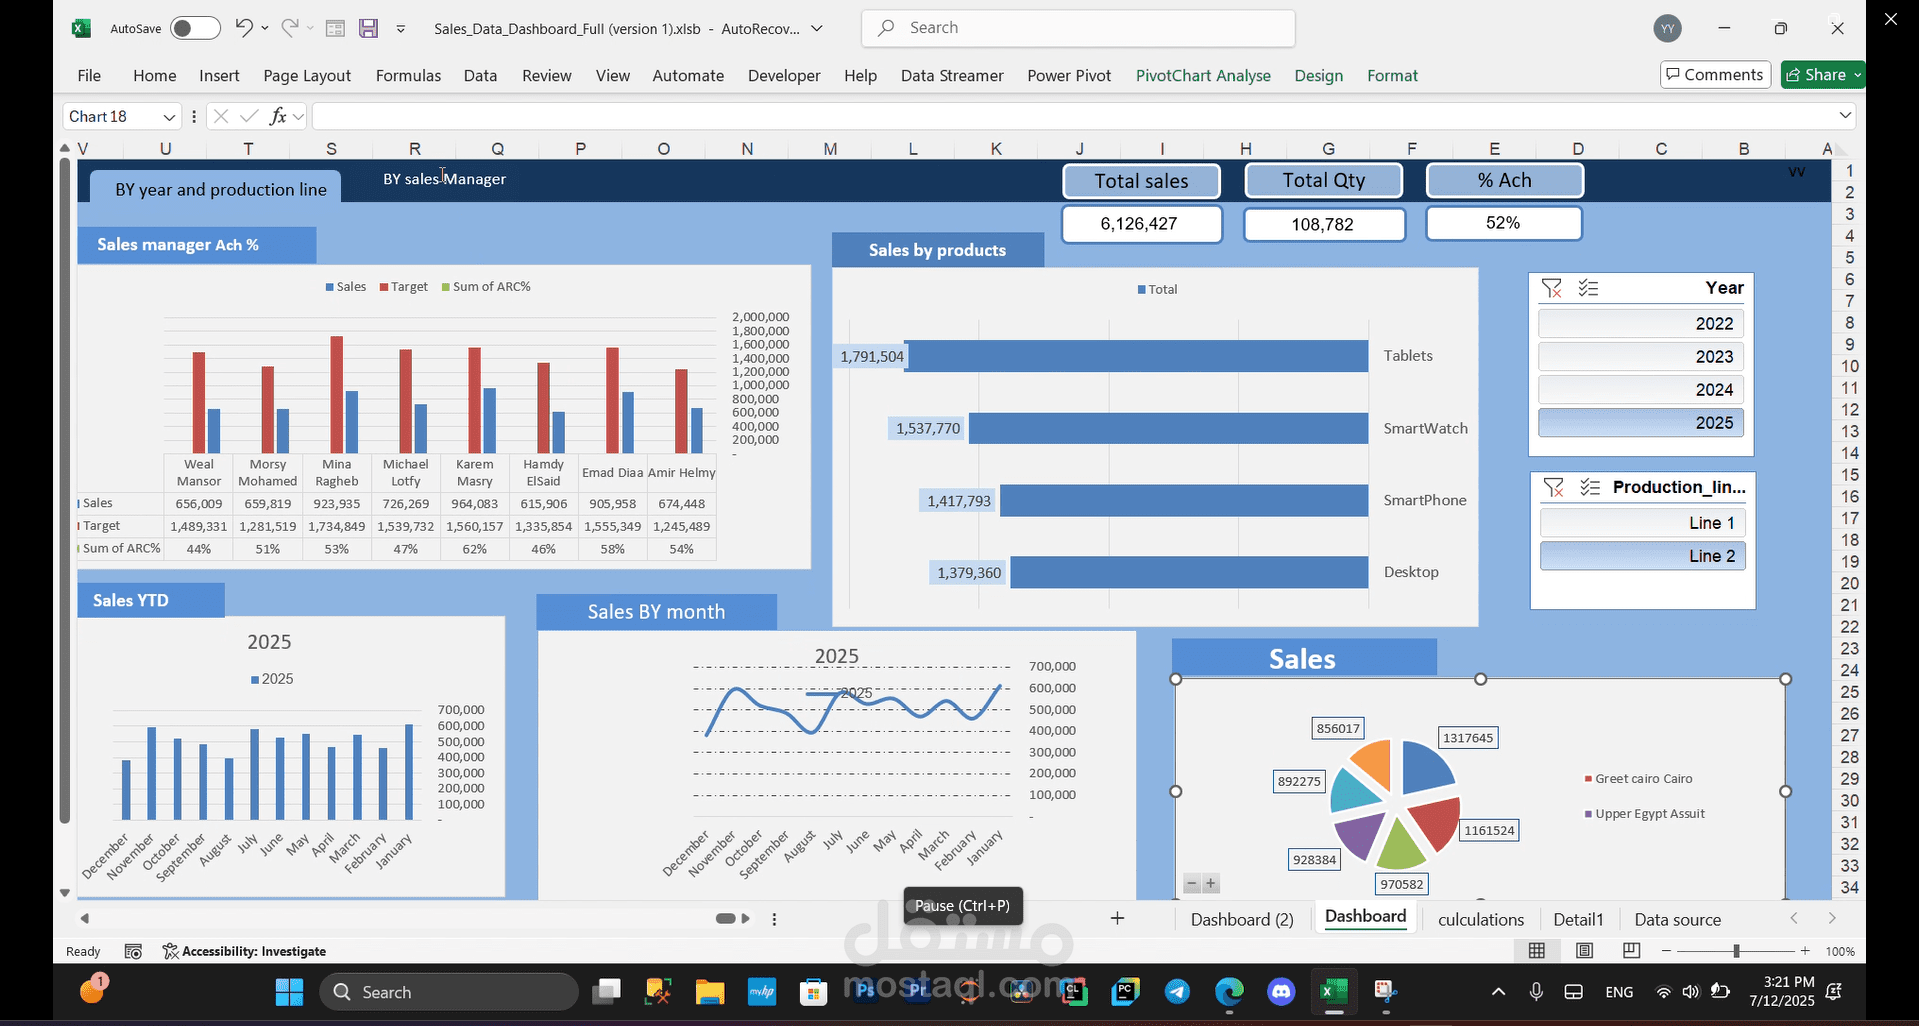
Pivot Tables: Utilized extensively for summarizing, grouping, and reorganizing large datasets, making complex data digestible and ready for analysis.
Slicers: Implemented to create intuitive and interactive filters, enabling users to effortlessly segment and analyze data without manual adjustments.
Multiple Visualizations: A diverse range of charts, including bar charts, line graphs, and pie charts, were employed to effectively represent various aspects of sales data, ensuring clarity and impact.
Formulas & Functions: Advanced Excel formulas were used to create calculated fields and ensure data accuracy and dynamic updates.