Ticket Registration Analysis
تفاصيل العمل
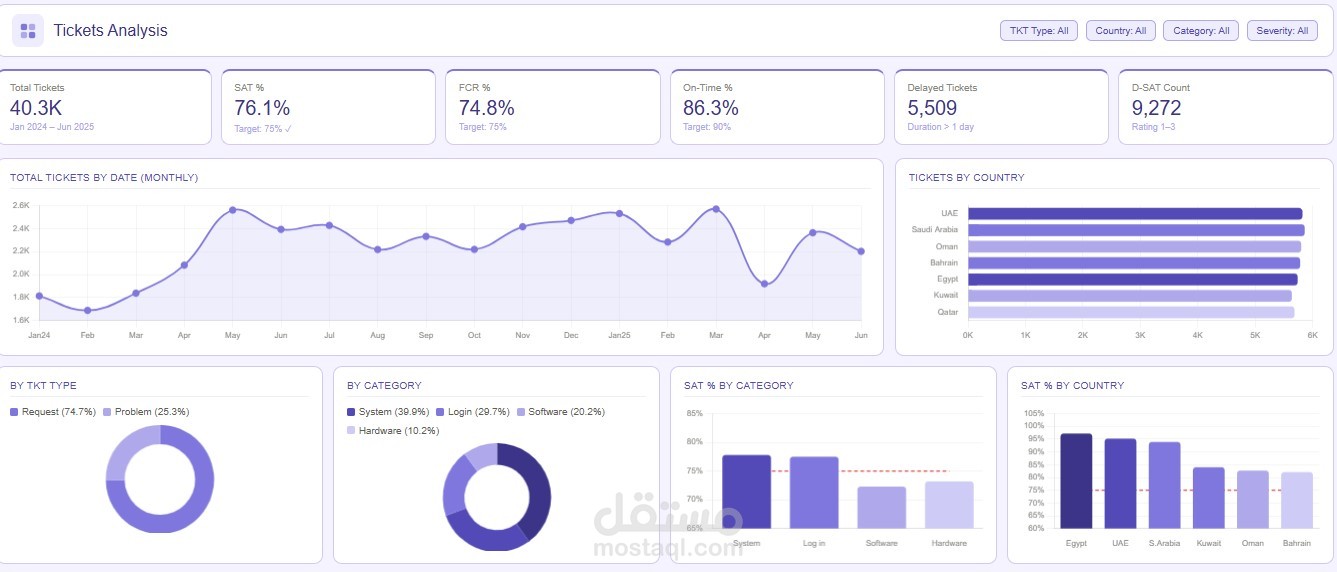
Power BI Customer Support Tickets Analysis Dashboard
I developed an interactive Customer Support Tickets Analysis Dashboard using Microsoft Power BI to help organizations monitor service performance, evaluate support efficiency, and improve customer satisfaction.
The dashboard presents key performance indicators (KPIs) that provide a quick overview of support operations, including Customer Satisfaction Rate (SAT%), First Contact Resolution (FCR%), On-Time Ticket Resolution, and Total Delayed Tickets. These metrics allow management to quickly assess the effectiveness and responsiveness of the support team.
To provide deeper operational insights, the dashboard includes several visual analytics:
• SAT% Trend Over Time: A time-series visualization that tracks customer satisfaction across months, quarters, and years, helping identify performance trends and improvements over time.
• SAT% by Country: A comparative analysis of customer satisfaction across different countries, enabling organizations to identify regional service performance and areas needing improvement.
• SAT% by Ticket Type: An analysis of satisfaction levels across different ticket types (such as requests and problems), helping support teams understand how issue types impact customer experience.
• SAT% by Ticket Category: A breakdown of satisfaction rates across different service categories (e.g., system issues, login access, hardware, software), highlighting which areas of support perform best.
• SAT% by Ticket Severity: Evaluates customer satisfaction based on ticket urgency levels such as high, low, normal, and urgent, providing insight into how critical cases are handled.
• Total Tickets by Rating: A distribution analysis of customer feedback ratings, helping measure overall service quality and identify improvement opportunities.
This dashboard demonstrates strong capabilities in data visualization, service performance analysis, and business intelligence reporting, turning operational support data into clear and actionable insights that can help organizations enhance service quality and customer satisfaction.
Tools Used:
Microsoft Power BI
Data Modeling and Data Transformation
Interactive Dashboard Design
Customer Experience and Service Performance Analytics