Sales Analysis
تفاصيل العمل
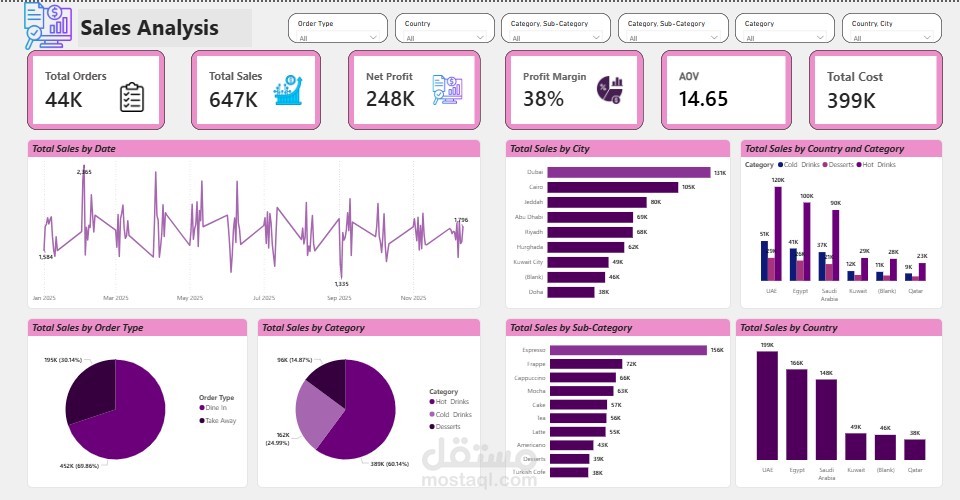
Power BI Sales Analysis Dashboard
I developed an interactive Sales Analysis Dashboard using Microsoft Power BI designed to help businesses monitor performance, identify trends, and make data-driven decisions.
The dashboard provides a clear overview of key business metrics including Total Orders, Total Sales, Net Profit, Profit Margin, Average Order Value (AOV), and Total Cost. These KPIs allow managers to quickly evaluate overall financial performance and profitability.
To support deeper analysis, the dashboard includes multiple dynamic visualizations:
• Sales Trend Over Time: A time-series chart showing how total sales evolve across the year, helping identify seasonal patterns and performance fluctuations.
• Sales by City: A ranking of top-performing cities, enabling businesses to recognize strong markets and potential growth locations.
• Sales by Country and Category: A comparative analysis of product categories across different countries, highlighting regional preferences and product performance.
• Sales by Order Type: A breakdown of sales between different order channels such as dine-in and takeaway, providing insights into customer purchasing behavior.
• Sales by Category and Sub-Category: Detailed analysis of product categories and individual items to determine top-selling products and optimize product offerings.
• Sales by Country: A geographic performance overview showing which markets generate the highest revenue.
The dashboard also includes interactive filters such as Order Type, Country, Category, Sub-Category, and City, allowing users to explore the data dynamically and customize the analysis based on their needs.
This project demonstrates strong skills in data visualization, business intelligence, and dashboard design, transforming raw sales data into clear, actionable insights that support strategic decision-making.
Tools Used:
Microsoft Power BI
Data Modeling
Interactive Visualizations
Business Performance Analysis