Data Analysis Country Migration
تفاصيل العمل
What causes people to leave one country and choose another?
What Makes a Country “Push” or “Pull” Migrants?
First, We Scraped our Data from two site[Worldometers,visionofhumanity]
For each Country :
(population, migrants (net), land area, Density, Fert. Rate, Median Age, Urban Rate, Gas Reserves MMcf, Safety Score, GDP
Per Person )
Step 1: Show Problem
Which countries show positive net migration, and which show negative net migration and Normal migration?
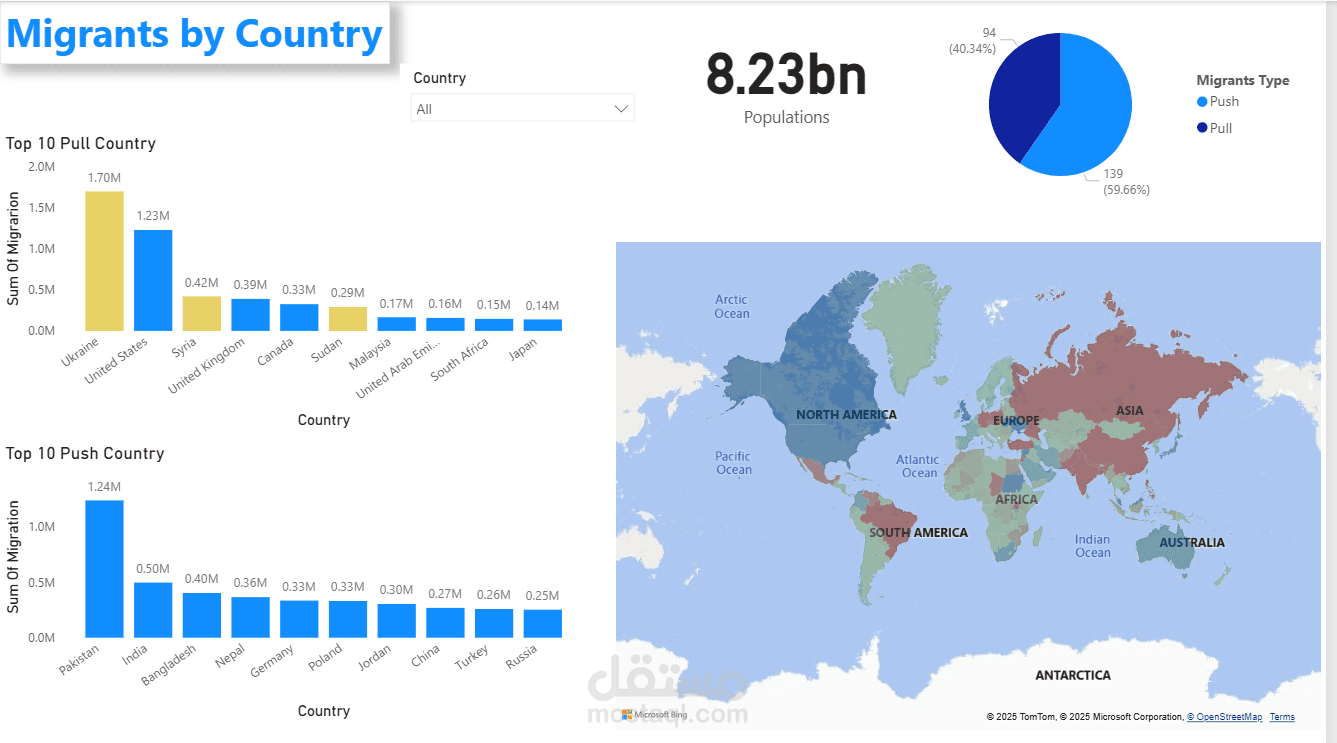
What Top 10 Country Pull Migrants?
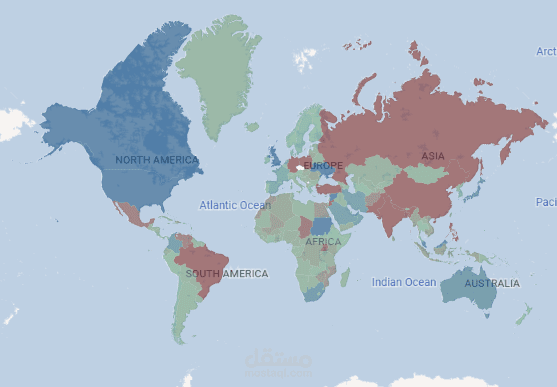
What Top 10 Country Push Migrants? -Filled map is used in data visualization to display how a single numeric variable (or measure) varies across defined geographical regions
Bar chart is used for compare categorical data with Numerical data
Insights: Blue regions is Pull Migrations Red is Push Migrations Green is Normal Rate
Note Ukraine , Syria, Sudan have Positive migrations because Return Flows
Step 2: GDP
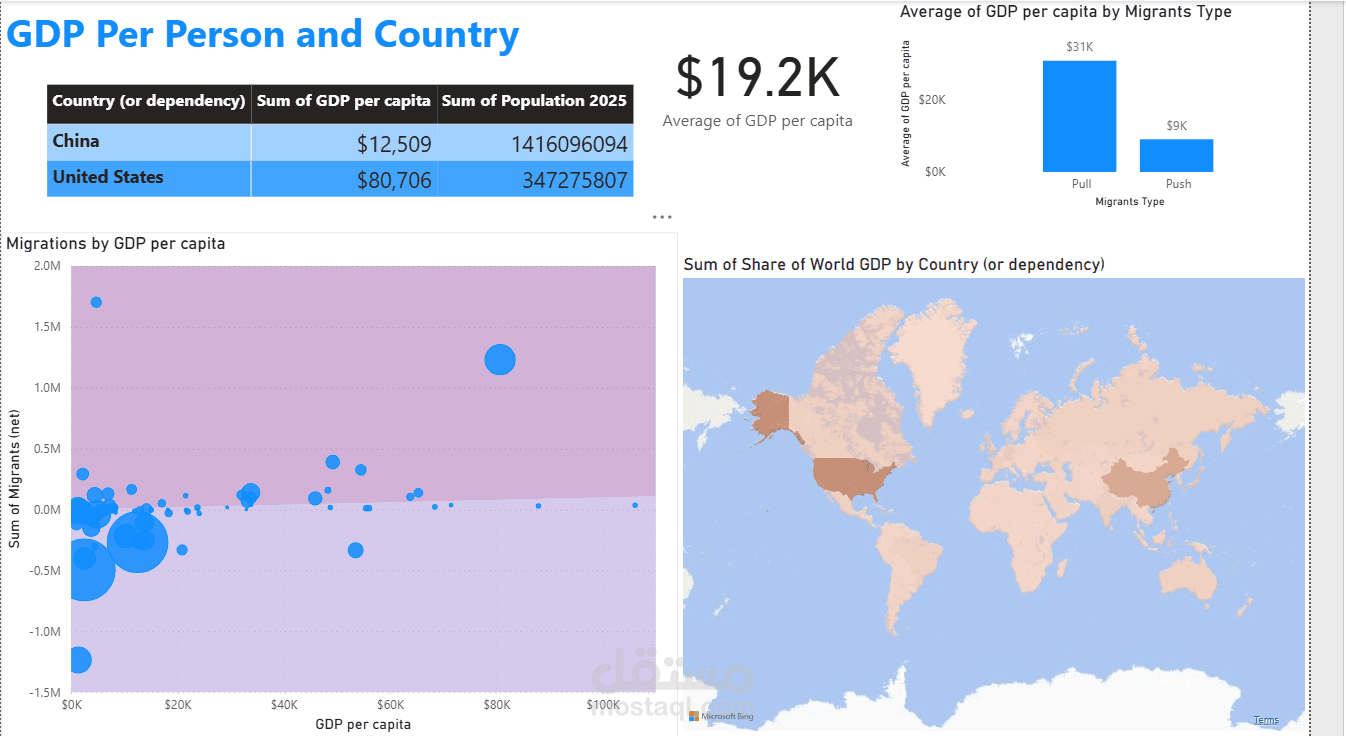
Is There a Gap between Pull and Push Country average GDP per person?
What Country has the World Share Economy ?
What relation between GDP per person and migrations net?
Scatter Plot: best for show relation between Two numerical feature
Insights: there is high Gap in GDP for Pull and push Migrations 9000$ and 30000$
USA and China Have 40% of world economy So, why china has negative migrations we have two reasons Low GDP per person and language
So GDP per person has high impact
Step 3: Demographics reasons
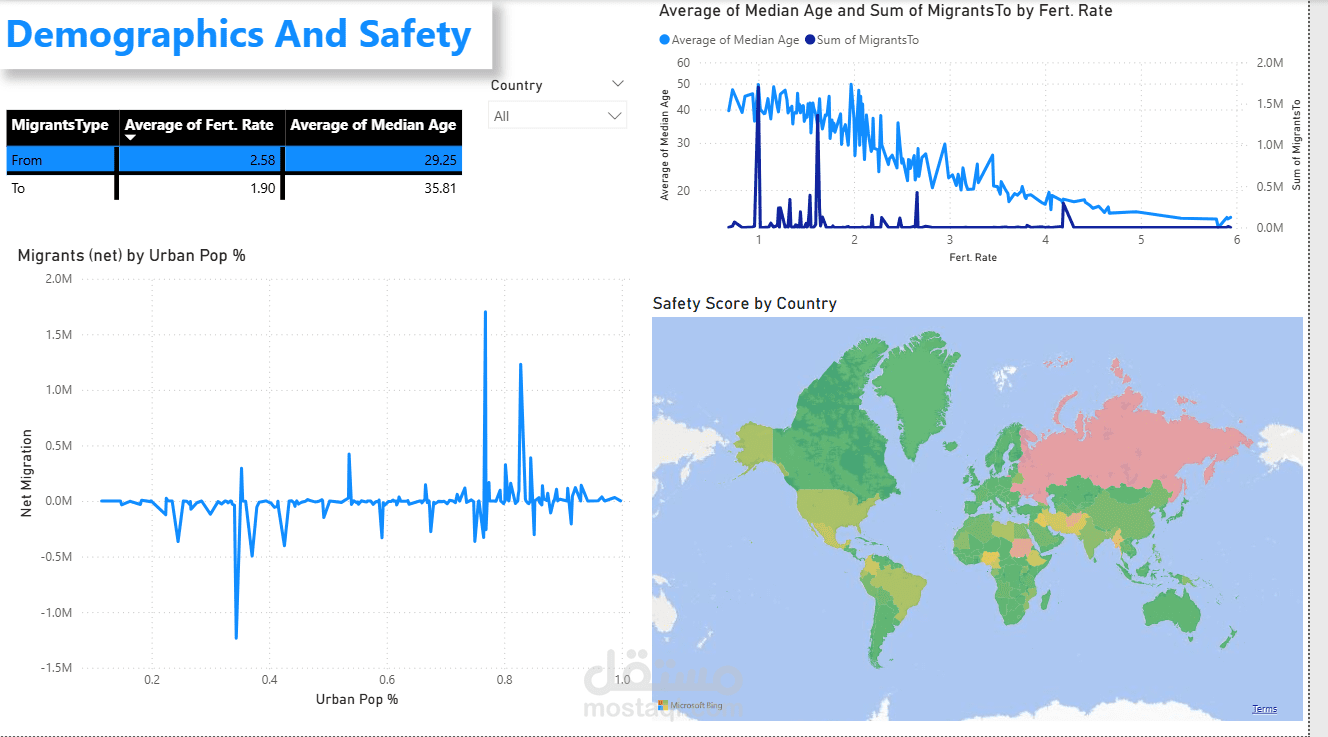
What regions have High or Low or normal GPI?
What relation between fertility rate and average age has an impact on Migrations? What relation between Urban rate and migrations?
Line Chart: A line chart is best used to show trends and changes over continuous data
Insights: There is High positive relation between urban rate and migrations , Russia , Sudan, Ukraine have bad GPI score
High negative relation between fertility rate and median age, low fertility = high median age = high opportunity = high migrations Pull rate
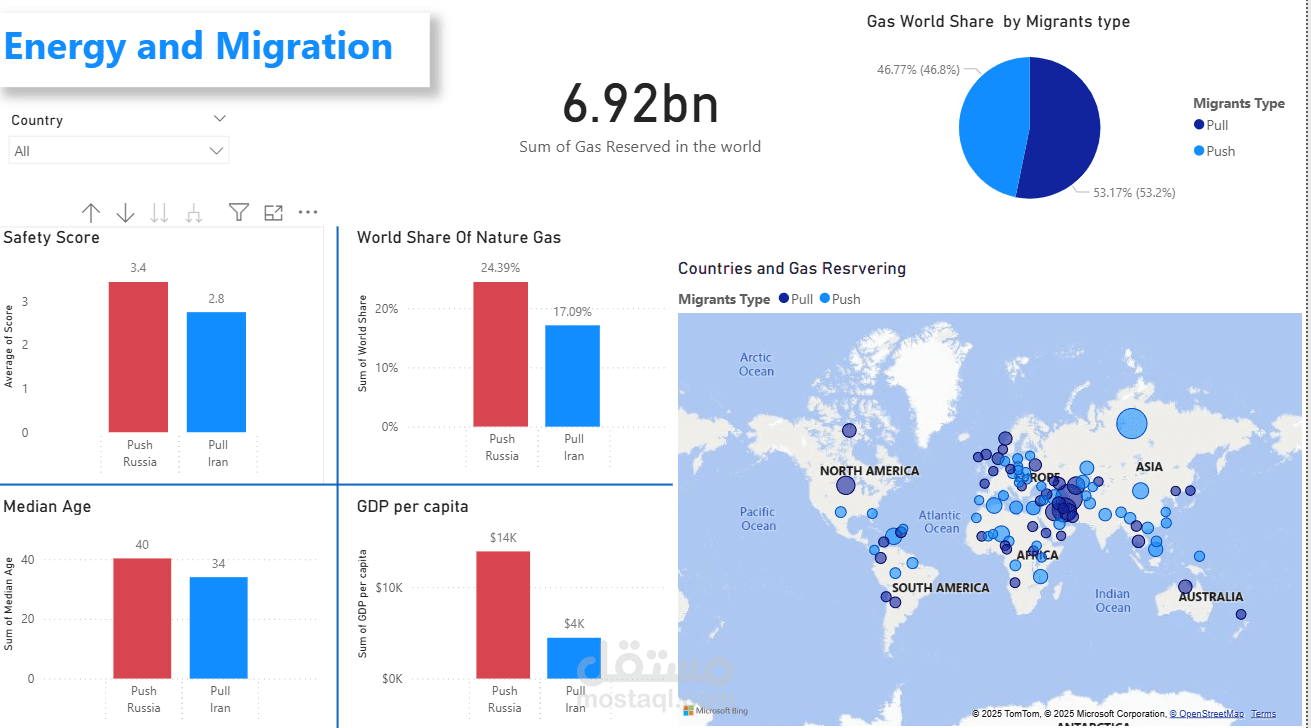
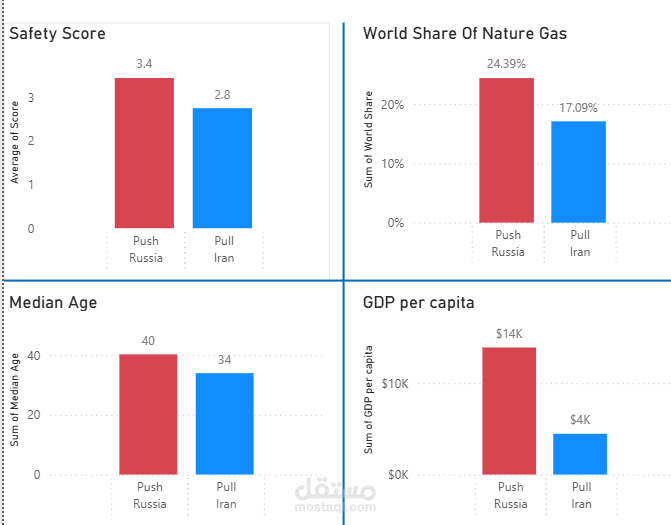
Step 4: Nature Gas
What Country has the most Gas Reserving? Compare between Pull and push country
insights : there is critical insight Russia has 24% of Gas and it’s a negative migration iran is second but positive why?
Russia is Lowest Safety score in the world So, Safety score is most Affect reasons
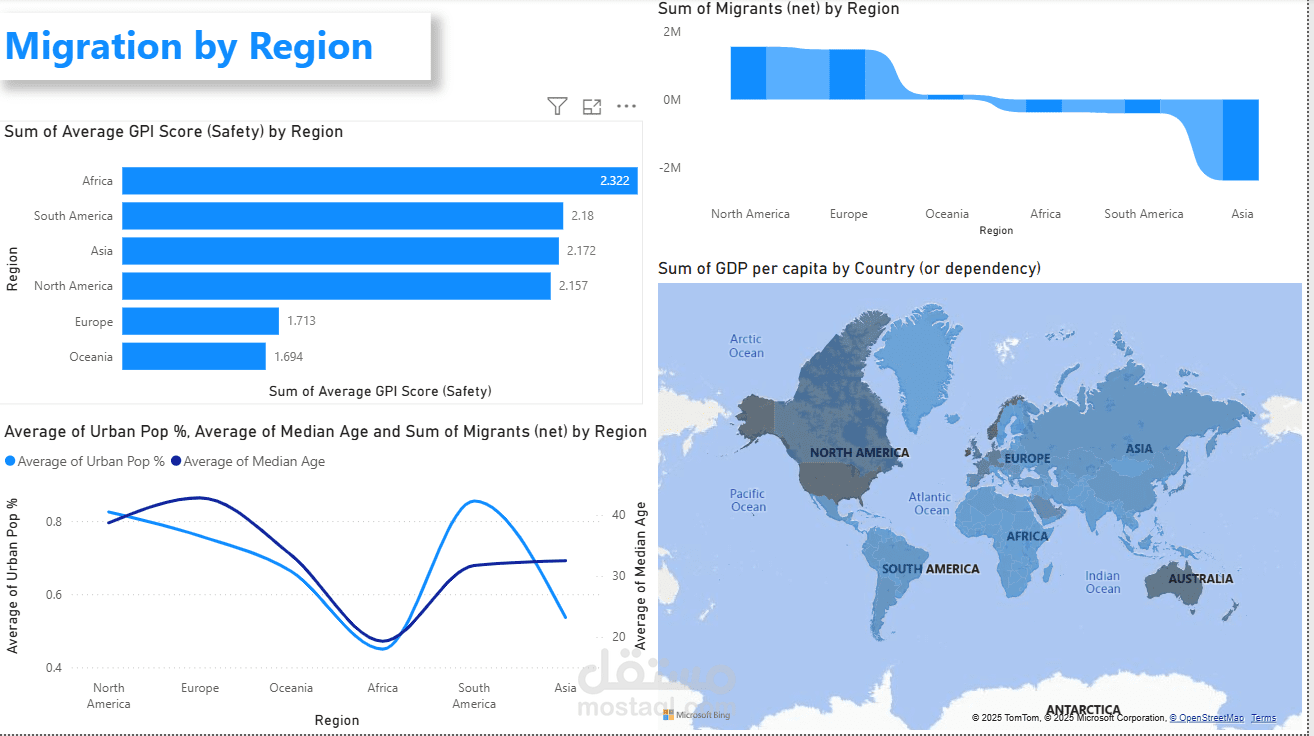
Step 5: Region
What regions pull or push migration?
Is GDP similar per region? What Relations between age and Urban per Region?
Why is Urban in South America high and urban but in negative migrations?
Insights: Africa and Asia and South America are negative migrations Why?
This Three regions also have lowest GDP per person ,Median Age, Urban Area, and Average GPI score
Conclusion:
The Three Determinants: A country's migratory status is ultimately determined by the interplay
of:
1. Geopolitical Stability (Safety): The most forceful Push.
2. Economic Prosperity (GDP Per Capita): The primary Pull for opportunity.
3. Socio-Economic Mobility (Opportunity): The assurance of future advancement.