Sold Unit Overview
تفاصيل العمل
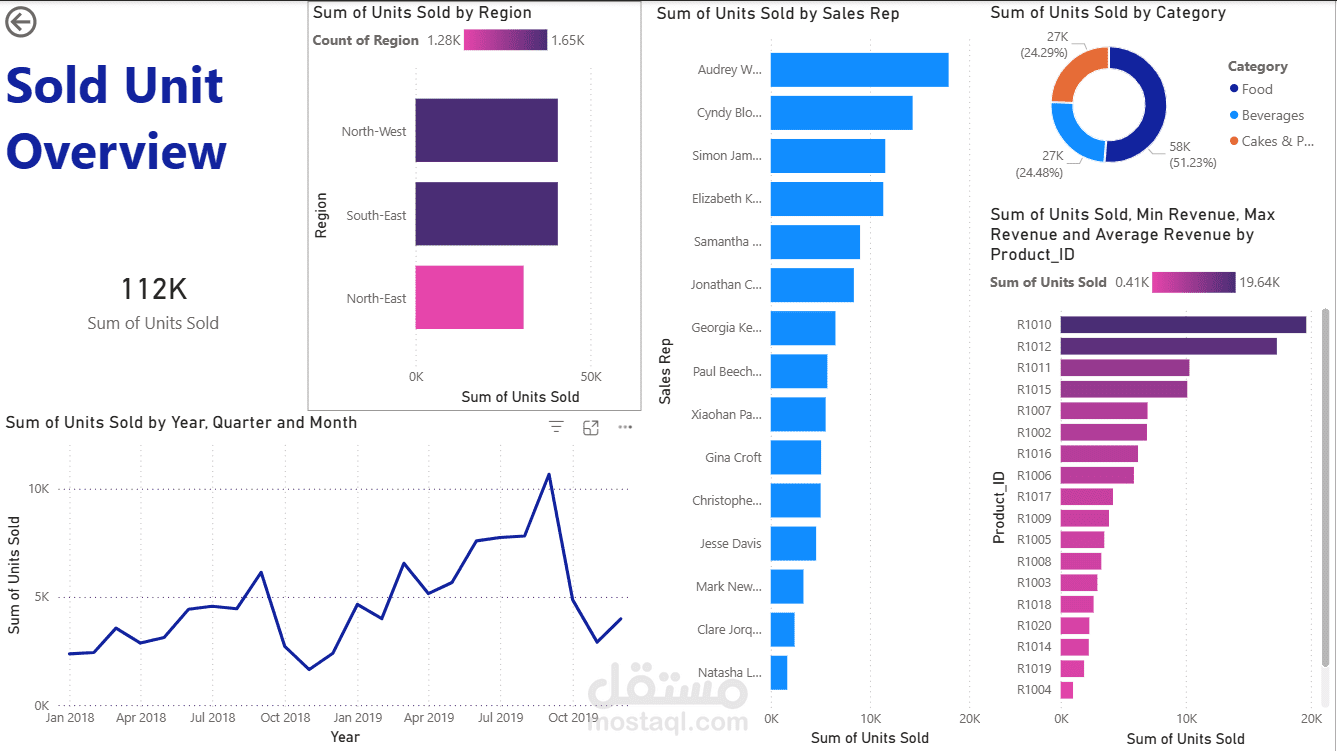
This project serves as a comprehensive demonstration of my data analysis workflow using Power BI. I transformed a raw, unorganized dataset into a highly interactive dashboard, focusing on the full lifecycle of data: from initial cleaning and complex modeling to advanced DAX calculations and final visualization.
Technical Implementation (Step-by-Step):
1. Data Preparation & ETL (Power Query):
Performed intensive Data Cleaning to ensure accuracy (handling nulls, duplicates, and data type corrections).
Applied complex Transformations in Power Query to restructure the data for optimal analytical use.
2. Robust Data Modeling (Table View):
Organized the Table View to establish a clear data hierarchy.
Designed a scalable Star Schema model, creating efficient relationships between Fact and Dimension tables to ensure high report performance.
3. Advanced Analytics (DAX):
Developed a suite of custom DAX Measures to extract deep insights.
Calculated key metrics: Total Units Sold, Revenue Growth, and Average Unit Price.
Implemented Time Intelligence functions to analyze Year-over-Year (YoY) and Month-over-Month (MoM) performance.
4. Professional Visualization (UI/UX):
Built a user-centric dashboard with a focus on Storytelling with Data.
Integrated interactive features: Slicers, Drill-throughs, and Dynamic Tooltips for an immersive user experience.
Tools Used:
Power BI Desktop (Visualization & Modeling)
Power Query (ETL Process)
DAX (Advanced Analytics)
Key Takeaway: This project highlights my ability to handle "dirty" data and build a reliable, automated reporting system from scratch.