BMW Sales analysis dashboard
تفاصيل العمل
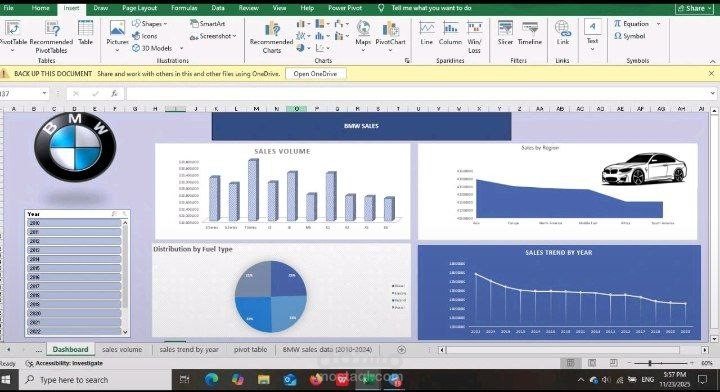
I created a BMW sales analysis dashboard using Excel to analyze and visualize sales data. The project focuses on transforming raw data into clear insights that help understand sales performance and trends.
During this project, I worked on:
Cleaning and preparing the dataset using Power Query
Creating calculated measures
Building Pivot Tables for data analysis
Designing an interactive dashboard
Adding charts, slicers, and KPIs for better visualization
The dashboard analyzes more than 50,000 car records and provides insights such as:
Total revenue
Sales trends by year
Top-selling BMW models
Sales distribution by region
Fuel type distribution
This project demonstrates my ability to clean data, analyze it, and present it in an interactive dashboard that helps in data-driven decision making.