Interactive HR Analytics Dashboard – Dynamic Insights with Excel
تفاصيل العمل
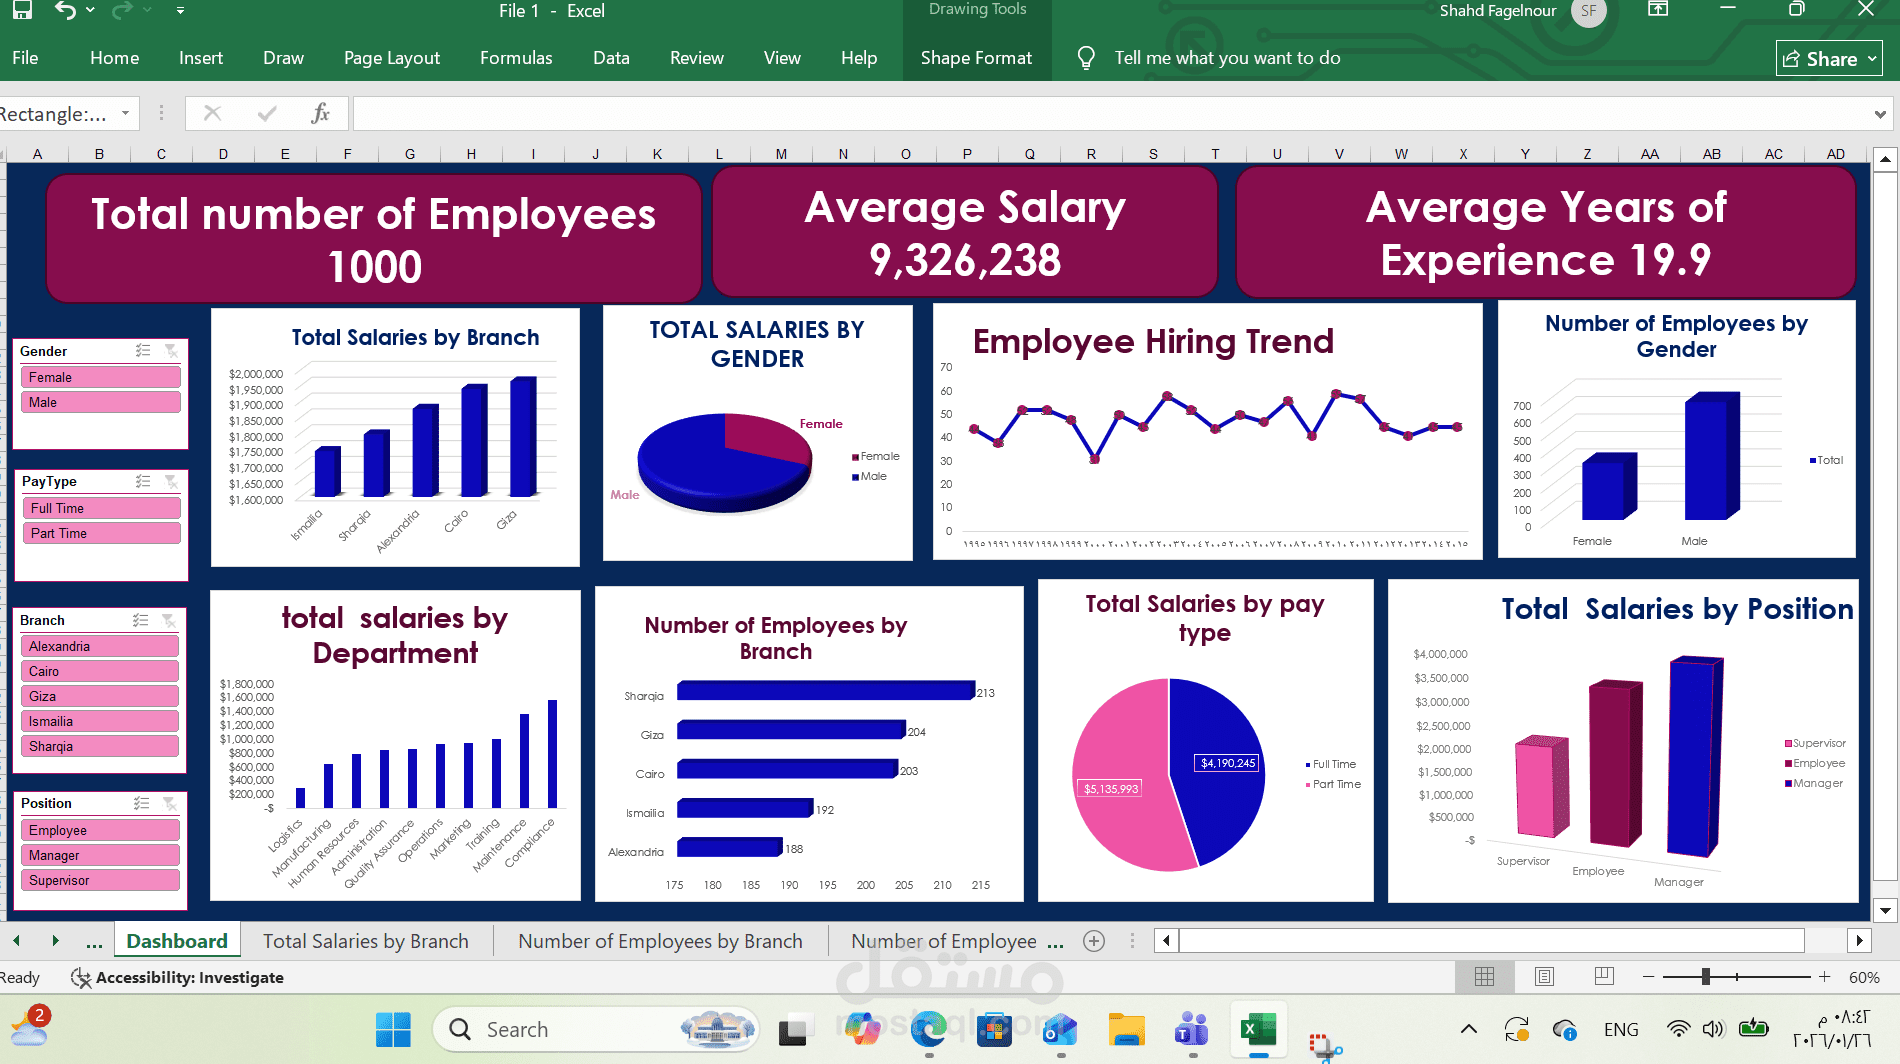
Created an interactive HR dashboard using Excel based on an HR dataset, focusing on data preparation, Pivot Tables, and dynamic visualization.
Prepared and organized data, then built multiple Pivot Tables and Pivot Charts.
Designed a single dashboard combining all required visuals such as hiring trends, salary distribution by department, gender, pay type, position, and branch, along with employee count analysis.
Added KPIs including total employees, average salary, and average years of experience.
Implemented interactive slicers (Gender, Pay Type, Position, Branch) to enable dynamic filtering.
Designed a clear, well-structured, and visually appealing dashboard for easy analysis.
This project highlights skills in Excel data analysis, dashboard design, and interactive reporting.