Profit Analysis Dashboard Power BI / DAX / Data Modeling / Data Visualization
تفاصيل العمل
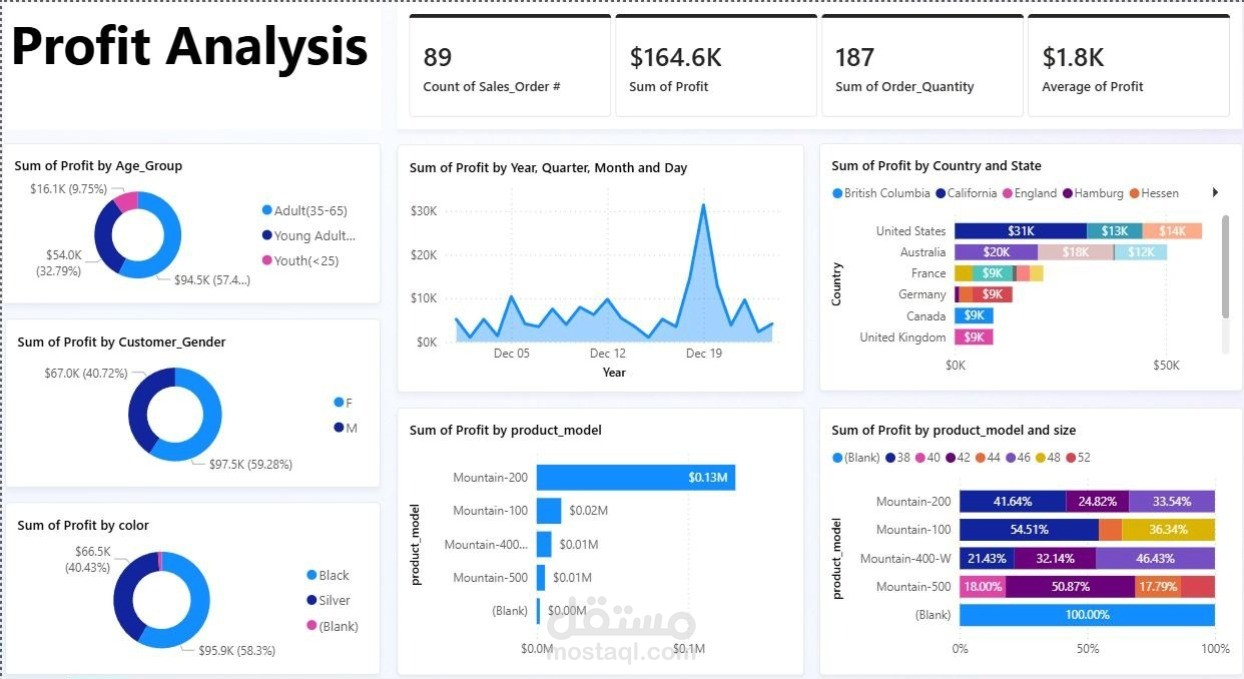
what did i do in this project ?
1. Developed an interactive Profit Analysis dashboard using Power BI.
2. Created DAX measures for Total Profit, Average Profit, Sales Orders, and Order
Quantity.
3. Analyzed profit trends across multiple time levels (year, quarter, month, day).
4. Evaluated profitability by country and state to identify high-performing markets.
5. Compared product models and sizes to determine top revenue contributors.
6. Segmented profit by customer demographics (age group and gender)
7. Designed KPI cards and dynamic visuals to support data-driven decision making.