Revenue Analysis Dashboard
تفاصيل العمل
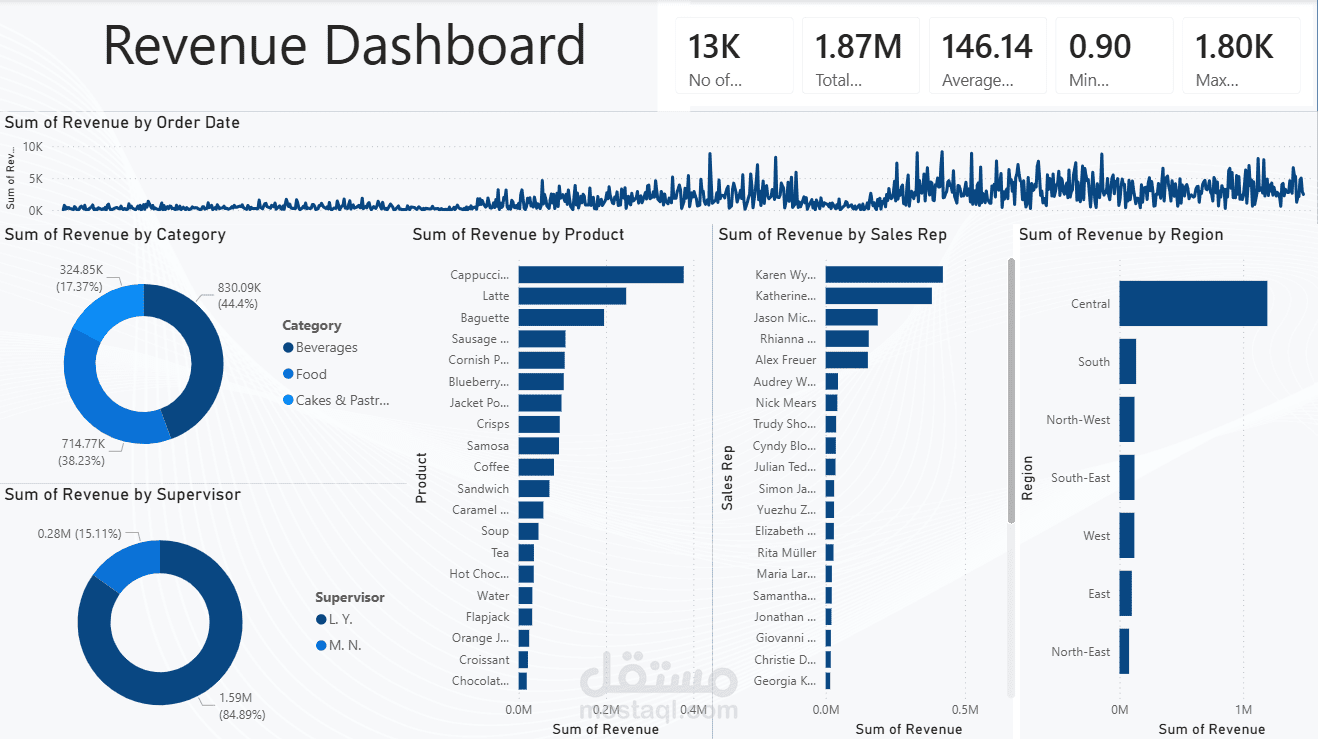
Built a Power BI dashboard tracking 1.87M in total revenue across 13K+ orders to evaluate overall business health.
Visualized revenue trends over time with a detailed timeline to spot sales patterns and peak transaction periods.
Analyzed product performance to identify top-selling categories (like Beverages and Food) and specific high-value items.
Evaluated team and regional success by breaking down revenue by Sales Rep, Supervisor, and Region to highlight top contributors.